Page 313 - DCOM203_DMGT204_QUANTITATIVE_TECHNIQUES_I
P. 313
Quantitative Techniques – I


                    Notes              The fitting of a normal curve can be done by
                                       (a)  The Method of Ordinates or
                                       (b)  The Method of Areas.
                                       (a)  Method of Ordinates: In this method, the ordinate f(X) of the normal curve, for various
                                            values of the random variate X are obtained by using the table of ordinates for a
                                            standard normal variate.

                                                                         2
                                                                    1 X           1
                                                               1    2         1    z  2  1
                                            We can write  f X     e              e  2     z
                                                                2             2
                                                                        1  2
                                                     X              1    z
                                            where   z      and   z    e  2  .
                                                                    2
                                            The expected frequency corresponding to a particular value of X is given by
                                                       N
                                             y  N.f X     z  and therefore, the expected frequency of a class = y   h, where h

                                            is the class interval.

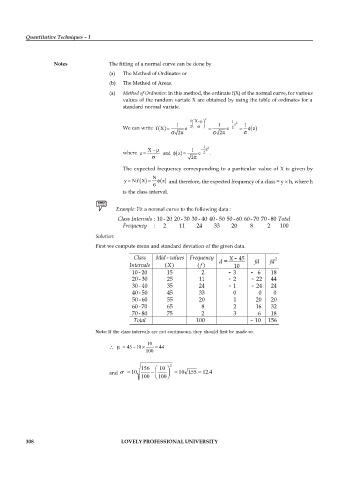
                                          Example: Fit a normal curve to the following data :

                                          Class Intervals : 10 - 20 20 - 30 30 - 40 40 - 50 50 - 60 60 -70 70 - 80 Total
                                            Frequency  :  2     11    24    33    20     8     2   100
                                   Solution:

                                   First we compute mean and standard deviation of the given data.
                                                 Class  Mid - values Frequency   X - 45           2
                                                                              d =          fd   fd
                                               Intervals       (X)       ( f )     10
                                               10 - 20      15          2        - 3     -  6   18
                                               20 - 30      25         11        - 2     - 22   44
                                               30 - 40      35         24        - 1     - 24   24
                                               40 - 50      45         33           0         0   0
                                               50 - 60      55         20           1       20  20
                                               60 -70       65          8           2       16  32
                                               70 - 80      75          2           3        6  18
                                                Total                 100                - 10  156
                                   Note: If the class intervals are not continuous, they should first be made so.

                                                     10
                                              45 10      44
                                                    100

                                                             2
                                                   156   10
                                                                          .
                                                                    .
                                       and     10               10 155  12 4
                                                   100   100


          308                               LOVELY PROFESSIONAL UNIVERSITY

