Page 323 - DECO401_MICROECONOMIC_THEORY_ENGLISH
P. 323
Microeconomic Theory


                   Notes
                                                                    Fig. 19.4


                                                                             TC
                                                            TR/TC/Profit  E  L  TR


                                                             M       B               P
                                                                           S
                                                                      C
                                                               O     Q DK       Output
                                                                             TP

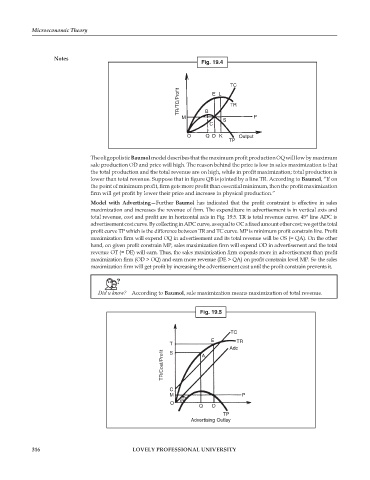
                               The oligopolistic Baumol model describes that the maximum profit production OQ will low by maximum
                               sale production OD and price will high. The reason behind the price is low in sales maximization is that
                               the total production and the total revenue are on high, while in profit maximization; total production is
                               lower than total revenue. Suppose that in figure QB is jointed by a line TR. According to Baumol, “If on
                               the point of minimum profit, firm gets more profit than essential minimum, then the profit maximization
                               firm will get profit by lower their price and increase in physical production.”
                               Model  with  Advertising—Further  Baumol  has  indicated  that  the  profit  constraint  is  effective  in  sales
                               maximization and increases the revenue of firm. The expenditure in advertisement is in vertical axis and
                               total revenue, cost and profit are in horizontal axis in Fig. 19.5. TR is total revenue curve. 45° line ADC is
                               advertisement cost curve. By collecting in ADC curve, as equal to OC a fixed amount other cost; we get the total
                               profit curve TP which is the difference between TR and TC curve. MP is minimum profit constrain line. Profit
                               maximization firm will expend OQ in advertisement and its total revenue will be OS (= QA). On the other
                               hand, on given profit constrain MP, sales maximization firm will expend OD in advertisement and the total
                               revenue OT (= DE) will earn. Thus, the sales maximization firm expends more in advertisement than profit
                               maximization firm (OD > OQ) and earn more revenue (DE > QA) on profit constrain level MP. So the sales
                               maximization firm will get profit by increasing the advertisement cost until the profit constrain prevents it.


                                              According to Baumol, sale maximization means maximization of total revenue.


                                                                   Fig. 19.5


                                                                             TC
                                                                       E       TR
                                                         T
                                                                             Adc
                                                       TR/Cost/Profit
                                                         S
                                                                    A


                                                         C
                                                         M                       P
                                                             45°
                                                         O
                                                                   Q   D
                                                                           TP
                                                                Advertising Outlay


            316                              LOVELY PROFESSIONAL UNIVERSITY

