Page 235 - DECO501_ECONOMICS_OF_GROWTH_AND_DEVELPOMENT_ENGLISH
P. 235

Unit 23: Low - Level Equilibrium Trap


              (iii) There is .................... investment in the economy when savings are negative implying a  Notes
                  situation where consumption is greater than  income.
              (iv) Nelson’s thesis advocates that if the country is to break the shackles of low level equilibrium
                  trap, into rate of growth of total income must be higher than .................... per year.
              (v) According to Nelson New investment is equal to ....................  created out of saving.

            23.2 Graphical Demonstration of Theory


                                       Population                  1
                                       Growth             b  c
                                       Rate         dp p
                                                      /

                                                   a
                                                                  (Y/ )
                                                                     p
                                             0


                                       Per capita                  2
                                       income         dK/ p

                                                 x=S=0
                                                  V
                                                                  (Y/ )
                                                                     p
                                             0

                                                     dP/P> Y/Y
                                                          d
                                 increase in                       3
                                 Population / Income
                                                      /
                                                     dp p
                                                            dY/Y
                                                  y
                                                                  (Y/p)
                                             0       V
                                                  dP/P= dY/Y
                                       dP/P< dY/Y
                                                 Fig 2
            Explanation
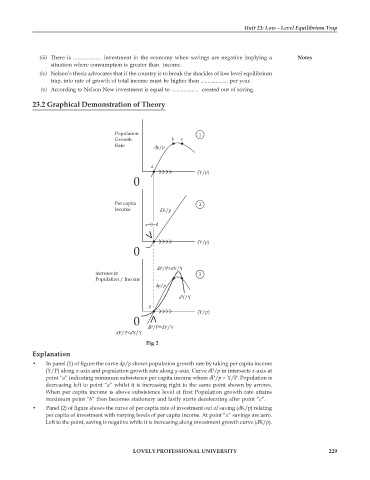
            •   In panel (1) of figure the curve dp/p shows population growth rate by taking per capita income
                (Y/P) along x-axis and population growth rate along y-axis. Curve dP/p in intersects x-axis at
                point “a” indicating minimum subsistence per capita income where dP/p = Y/P. Population is
                decreasing left to point “a” whilst it is increasing right to the same point shown by arrows.
                When per capita income is above subsistence level at first Population growth rate attains
                maximum point “b” then becomes stationary and lastly starts decelerating after point “c”.
            •   Panel (2) of figure shows the curve of per capita rate of investment out of saving (dK/p) relating
                per capita of investment with varying levels of per capita income. At point “x” savings are zero.
                Left to the point, saving is negative while it is increasing along investment growth curve (dK/p).


                                             LOVELY PROFESSIONAL UNIVERSITY                                   229
   230   231   232   233   234   235   236   237   238   239   240