Page 310 - DECO503_INTERNATIONAL_TRADE_AND_FINANCE_ENGLISH
P. 310
International Trade and Finance


                  Notes          risk of investing overseas. Foreign investors also tend to opt for larger scale and higher capital-
                                 intensity plants than the average U.S. firm to offset the risks inherent in investing abroad and to
                                 generate higher profits to make it economical to manage an operation far removed from the parent
                                 firm.
                                 Most economists conclude that foreign investment benefits the host economy because such investment
                                 adds permanently to the capital stock of the economy and increases the total amount of capital in the
                                 economy. While these conclusions seem generally to be true, they probably should be tempered
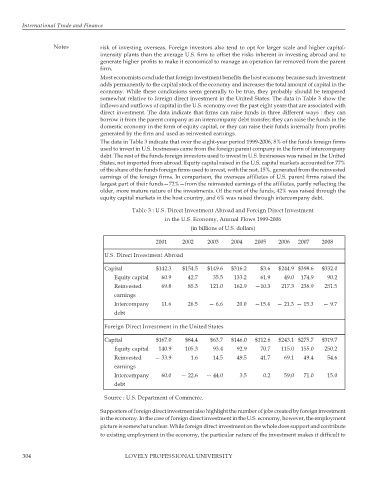
                                 somewhat relative to foreign direct investment in the United States. The data in Table 3 show the
                                 inflows and outflows of capital in the U.S. economy over the past eight years that are associated with
                                 direct investment. The data indicate that firms can raise funds in three different ways : they can
                                 borrow it from the parent company as an intercompany debt transfer; they can raise the funds in the
                                 domestic economy in the form of equity capital, or they can raise their funds internally from profits
                                 generated by the firm and used as reinvested earnings.
                                 The data in Table 3 indicate that over the eight-year period 1999-2006, 8% of the funds foreign firms
                                 used to invest in U.S. businesses came from the foreign parent company in the form of intercompany
                                 debt. The rest of the funds foreign investors used to invest in U.S. businesses was raised in the United
                                 States, not imported from abroad. Equity capital raised in the U.S. capital markets accounted for 77%
                                 of the share of the funds foreign firms used to invest, with the rest, 15%, generated from the reinvested
                                 earnings of the foreign firms. In comparison, the overseas affiliates of U.S. parent firms raised the
                                 largest part of their funds—72%—from the reinvested earnings of the affiliates, partly reflecting the
                                 older, more mature nature of the investments. Of the rest of the funds, 42% was raised through the
                                 equity capital markets in the host country, and 6% was raised through intercompany debt.

                                            Table 3 : U.S. Direct Investment Abroad and Foreign Direct Investment
                                                      in the U.S. Economy, Annual Flows 1999-2006
                                                               (in billions of U.S. dollars)

                                                   2001     2002    2003    2004   2005    2006  2007    2008

                                   U.S. Direct Investment Abroad

                                   Capital         $142.3   $154.5  $149.6  $316.2   $3.6  $244.9 $398.6  $332.0
                                      Equity capital  60.9    42.7    35.5   133.2   61.9    49.0  174.9   90.2
                                      Reinvested     69.8     85.3   121.0   162.9  —10.3   217.3  238.9  251.5
                                      earnings
                                      Intercompany   11.6     26.5  — 6.6    20.0  —15.4  — 21.3 — 15.3  — 9.7
                                      debt

                                   Foreign Direct Investment in the United States

                                   Capital         $167.0    $84.4   $63.7  $146.0  $112.6  $243.1 $275.7  $319.7
                                      Equity capital  140.9  105.3    93.4   92.9    70.7   115.0  155.0  250.2
                                      Reinvested   — 33.9      1.6    14.5   49.5    41.7    69.1  49.4    54.6
                                      earnings
                                      Intercompany   60.0  — 22.6   — 44.0    3.5     0.2    59.0  71.0    15.0
                                      debt

                                   Source : U.S. Department of Commerce.
                                 Supporters of foreign direct investment also highlight the number of jobs created by foreign investment
                                 in the economy. In the case of foreign direct investment in the U.S. economy, however, the employment
                                 picture is somewhat unclear. While foreign direct investment on the whole does support and contribute
                                 to existing employment in the economy, the particular nature of the investment makes it difficult to


        304                              LOVELY PROFESSIONAL UNIVERSITY

