
Page 358 - DECO504_STATISTICAL_METHODS_IN_ECONOMICS_ENGLISH
P. 358
Unit 28: Theory of Estimation: Point Estimation, Unbiasedness, Consistency, Efficiency and Sufficiency
called a Statistic. For example, the arithmetic mean x of the sample x , x , x , ..., x , is also a random Notes
1 2 3 n
variable, as also a Statistic. This is illustrated by the numerical example given below:
Let the population comprise only 3 values, say 1, 2 and 3. If a sample of size 2 is taken, then there are
3 possible samples viz. 1 & 2, 1 & 3, 2 & 3.
It may be noted from the following Table 1 that the sample means are much closer to each other (in
the range from 1.5 to 2.5) than the population values (in the range from 1 to 3). This is quantified by
the variance calculated in both the cases. While the variance of the population values is 2/3, the
variance of sample means is only 1/6.
Table 1: Variance of Sample Means
Population Arithmetic Variance Samples of Arithmetic Mean Variance of
Values Mean of Two values of the Three the Three
Population Samples Sample Means
1 2 2/3 1, 2 1.5 1/6
2 1, 3 2.0
3 2, 3 2.5
In general, if the variance of the population with finite units is σ 2 , the variance of the sample means
from the population is {(N – n)/(N – 1)} ( 2 ) σ /n , where n is the size of each sample and N is the
population size. In the above case, N = 3, and n = 2. Therefore, variance of sample mean = {(3 – 2)/ (3
– 1)} {(2/3)/2} = 1/3 × 1/2 = 1/6.
However, if the population size is large as compared to the sample, then the variance of the sample
2
mean is simply σ /n .
Incidentally, the standard deviation of the sample mean is known as the standard error of the mean.
It is a measure of the extent to which sample means could be expected to vary from sample to sample.
No statistic can be guaranteed to provide a close value of the parameter on each and every occasion,
and for every sample. Therefore, one has to be content with formulating a rule/method which provides
good results in the long run or which has a high probability of success.
Incidentally, while the method or rule of estimation is called an estimator like sample
mean, the value which the method or rule gives in a particular case is called an estimate.
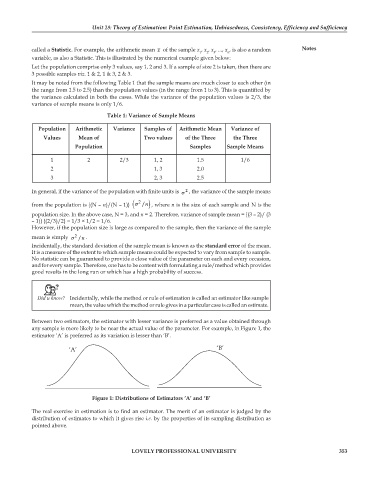
Between two estimators, the estimator with lesser variance is preferred as a value obtained through
any sample is more likely to be near the actual value of the parameter. For example, in Figure 1, the
estimator ‘A’ is preferred as its variation is lesser than ‘B’.
‘A’ ‘B’
Figure 1: Distributions of Estimators ‘A’ and ‘B’
The real exercise in estimation is to find an estimator. The merit of an estimator is judged by the
distribution of estimates to which it gives rise i.e. by the properties of its sampling distribution as
pointed above.
LOVELY PROFESSIONAL UNIVERSITY 353