Page 373 - DMTH404_STATISTICS
P. 373

2
                                                                                          Unit 26:   - Test Hypothesis


                              2
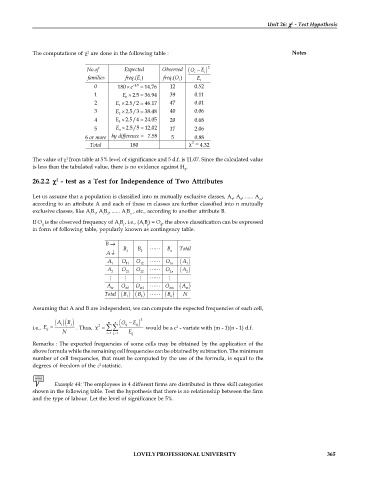
            The computations of   are done in the following table :                              Notes

                              No .of      Expected     Observed  (O -  E i  ) 2
                                                                 i
                              families    freq .( )    freq .(O i  )  E i
                                              E
                                               i
                                0       180 e - 2.5  =  14.76  12  0.52
                                           ´
                                1         E ´ 2.5 =  36.94  39   0.11
                                           0
                                2      E ´  2.5/2 =  46.17  47   0.01
                                        1
                                3      E ´  2.5/3 =  38.48  40   0.06
                                        2
                                4      E ´  2.5/4 =  24.05  20   0.68
                                        3
                                5      E ´ 2.5/5 =  12.02  17    2.06
                                        4
                             6 or more  by difference =  7.58  5  0.88
                                                                 2
                               Total        180                  =  4.32
            The value of  from table at 5% level of significance and 5 d.f. is 11.07. Since the calculated value
                       2
            is less than the tabulated value, there is no evidence against H .
                                                              0
                    2
            26.2.2   - test as a Test for Independence of Two Attributes
            Let us assume that a population is classified into m mutually exclusive classes, A , A , ...... A ,
                                                                              1  2     m
            according to an attribute A and each of these m classes are further classified into  n mutually
            exclusive classes, like A B , A B , ...... A B  , etc., according to another attribute B.
                               i  1  i  2  i  n
            If O  is the observed frequency of A B , i.e., (A B) = O , the above classification can be expressed
               ij                       i  j    i  j  ij
            in form of following table, popularly known as contingency table.

                                    B 
                                          B 1  B 2    B n  Total
                                    A 
                                                             A
                                     A 1  O 11  O 12    O 1n  ( )
                                                               1
                                     A   O    O       O    (A  )
                                      2    21  22        2n    2
                                                    
                                    A    O    O       O   (A  )
                                      m    m 1  m  2     mn   m
                                          B
                                               B
                                                        B
                                    Total  ( ) ( )    ( )   N
                                           1
                                                2
                                                         n
            Assuming that A and B are independent, we can compute the expected frequencies of each cell,
                   ( )( )            m  n  (O -  E  ) 2
                       B
                    A
                                  2
            i.e.,  E =  i  j  . Thus,   =  åå  ij  ij   would be a c  - variate with (m - 1)(n - 1) d.f.
                                                           2
                ij
                      N             i=  1 j=  1  E ij
            Remarks : The expected frequencies of some cells may be obtained by the application of the
            above formula while the remaining cell frequencies can be obtained by subtraction. The minimum
            number of cell frequencies, that must be computed by the use of the formula, is equal to the
                                  2
            degrees of freedom of the c statistic.
                   Example 44: The employees in 4 different firms are distributed in three skill categories
            shown in the following table. Test the hypothesis that there is no relationship between the firm
            and the type of labour. Let the level of significance be 5%.


                                             LOVELY PROFESSIONAL UNIVERSITY                                  365
   368   369   370   371   372   373   374   375   376   377   378