Page 194 - DMGT405_FINANCIAL%20MANAGEMENT
P. 194

Financial Management


                      Notes         (b) dependent. Independent means cash flows in future years are not affected by cash flows in the
                                    preceding or following years. On the other hand, when cash flows in one period are dependent
                                    on cash flows in previous year, they are referred to as dependent cash flows. Let us first discuss
                                    the application  of  probability  theory  to  analyze  risk  in  capital  budgeting assumption  of
                                    independent cash flows:

                                                           n  Expected cash inflow during each period
                                    1.            NPV = å                                      – Cash outflow
                                                                    +
                                                          t = 1   (1 riskless rate of interest)
                                                      t = 1 (1 + riskless rate of interest)t
                                                      t = years/period
                                         Now expected cash inflow in each period = Diff. levels of cash inflow × Probability at each
                                         level

                                                                                                    2
                                            Probability at   æ different levels cash inflow   expected cash inflow ö
                                                        ×                        -
                                          n  each level   ç                in each period  each period  ÷
                                    2.   å                è                                        ø
                                                               +
                                         t = 1               (1 riskless rate of interest) 2t
                                    3.   By making use of normal probability distribution, one can analyze further. The element
                                         of risk in capital budgeting i.e. probability of different expected values of  NPV i.e. the
                                         probability, of NPV having the value, zero or less, greater than within the range of two
                                         values  and  so on.  Thus,  the  normal  probability  distribution  an important  statistical
                                         technique in the hands of decision makers for evaluating the extent of risk of the project.


                                       Notes  The normal probability has a number of useful properties as follows:
                                       1.  The  area under  normal curve,  representing the  normal probability  distribution
                                           equal to 1 (0.5 on either side of the mean).
                                       2.  The curve has its maximum height at its expected value i.e., mean.

                                       3.  The probability  of occurrence beyond 3  x Standard Deviation is very near zero
                                           (0.26%).
                                       4.  Probability of an outcome falling within plus or minus 1 × standard deviation from
                                           the mean is 0.6826 or 68.26%, Range + 2 standard deviation 95.46%. Range + 3 standard
                                           deviation 99.74%.


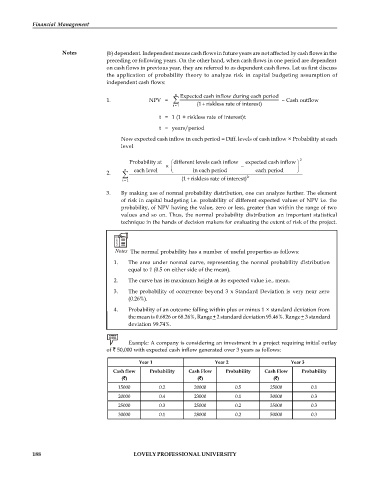
                                           Example: A company is considering an investment in a project requiring initial outlay
                                    of   50,000 with expected cash inflow generated over 3 years as follows:
                                               Year 1                   Year 2                   Year 3
                                      Cash flow    Probability   Cash Flow   Probability   Cash Flow   Probability
                                         ( )                      ( )                      ( )
                                        15000         0.2        20000         0.5        25000         0.1
                                        20000         0.4        23000         0.1        30000         0.3
                                        25000         0.3        25000         0.2        35000         0.3
                                        30000         0.1        28000         0.2        50000         0.3


            188                              LOVELY PROFESSIONAL UNIVERSITY
   189   190   191   192   193   194   195   196   197   198   199