Page 285 - DCAP312_WEB_TECHNOLOGIES_II
P. 285
Unit 14: Debugging and Optimization


            Performance profiling is a time-dependent activity because application performance changes over   Notes
            time. Performance may change periodically throughout the day or as the load on the application
            fluctuates. Alternatively, application performance may experience degradation over a long period
            of time, particularly as the database grows. Performance profiling must begin with a baseline,
            which is a set of metrics that define the performance at a specific time, under a specific set of
            conditions. The baseline is the measure against which future performance will be compared.
            A baseline includes a description of both hardware and software, and it typically includes a
            range of performance numbers that were derived without changing the hardware configuration.
            This is an example of a baseline description:

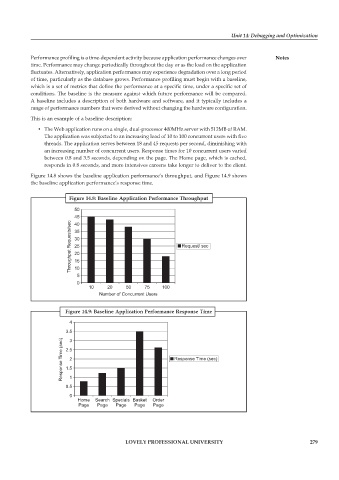
               •  The Web application runs on a single, dual-processor 400MHz server with 512MB of RAM.
                 The application was subjected to an increasing load of 10 to 100 concurrent users with five
                 threads. The application serves between 18 and 45 requests per second, diminishing with
                 an increasing number of concurrent users. Response times for 10 concurrent users varied
                 between 0.8 and 3.5 seconds, depending on the page. The Home page, which is cached,
                 responds in 0.8 seconds, and more intensives careens take longer to deliver to the client.

            Figure 14.8 shows the baseline application performance’s throughput, and Figure 14.9 shows
            the baseline application performance’s response time.


                         Figure 14.8: Baseline Application Performance Throughput


                        Figure 14.9: Baseline Application Performance Response Time
                         4
                        3.5
                       Time (sec)  2.5                        Response Time (sec)
                         3

                         2
                       Response  1.5

                         1
                        0.5
                         0
                            Home  Search Specials Basket  Order
                             Page  Page   Page  Page   Page


                                             LOVELY PROFESSIONAL UNIVERSITY                                   279

