Page 197 - DCAP405_SOFTWARE_ENGINEERING
P. 197
Software Engineering
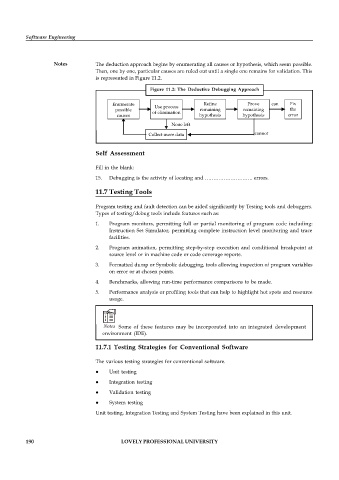
Notes The deduction approach begins by enumerating all causes or hypothesis, which seem possible.
Then, one by one, particular causes are ruled out until a single one remains for validation. This
is represented in Figure 11.2.
Figure 11.2: The Deductive Debugging Approach
Enumerate Refine Prove can Fix
Use process
possible of elimination remaining remaining the
causes hypothesis hypothesis error
None left
Collect more data cannot
Self Assessment
Fill in the blank:
15. Debugging is the activity of locating and ………………………. errors.
11.7 Testing Tools
Program testing and fault detection can be aided significantly by Testing tools and debuggers.
Types of testing/debug tools include features such as:
1. Program monitors, permitting full or partial monitoring of program code including:
Instruction Set Simulator, permitting complete instruction level monitoring and trace
facilities.
2. Program animation, permitting step-by-step execution and conditional breakpoint at
source level or in machine code or code coverage reports.
3. Formatted dump or Symbolic debugging, tools allowing inspection of program variables
on error or at chosen points.
4. Benchmarks, allowing run-time performance comparisons to be made.
5. Performance analysis or profiling tools that can help to highlight hot spots and resource
usage.
Notes Some of these features may be incorporated into an integrated development
environment (IDE).
11.7.1 Testing Strategies for Conventional Software
The various testing strategies for conventional software.
Unit testing
Integration testing
Validation testing
System testing
Unit testing, Integration Testing and System Testing have been explained in this unit.
190 LOVELY PROFESSIONAL UNIVERSITY

