Page 323 - DECO403_MATHEMATICS_FOR_ECONOMISTS_ENGLISH
P. 323
Mathematics for Economists


               Note           3.  Each industry produces only one product and there is no joint production of two products.
                              4.  Total output of an industry is used as input for any other industry.
                              5.  Production is done under rule of constant return.
                              6.  Technical development is constant, it means that input coefficients are constant
                              7.  Here in production no external austerity or improvidences are created


                            Leontief’s Static Input-Output Model – Open Model
                            Leontief’s Static Input-Output Model is based on the above assumptions. This can be understood
                            with an example. Suppose the economy is divided into three parts. Out of which agriculture and
                            industry are inter-trades and domestic part is expressed as last demand part.
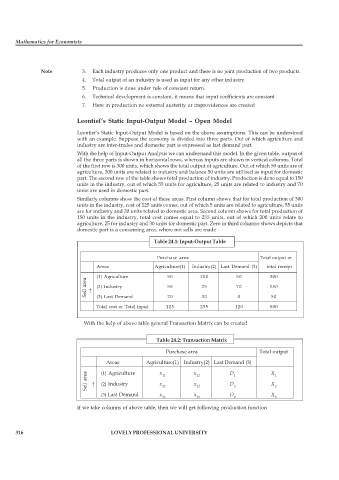
                            With the help of Input-Output Analysis we can understand this model. In the given table, output of
                            all the three parts is shown in horizontal rows, whereas inputs are shown in vertical columns. Total
                            of the first row is 300 units, which shows the total output of agriculture. Out of which 50 units are of
                            agriculture, 200 units are related to industry and balance 50 units are utilized as input for domestic
                            part. The second row of the table shows total production of industry. Production is done equal to 150
                            units in the industry, out of which 55 units for agriculture, 25 units are related to industry and 70
                            units are used in domestic part.
                            Similarly columns show the cost of these areas. First column shows that for total production of 300
                            units in the industry, cost of 125 units comes, out of which 5 units are related to agriculture, 55 units
                            are for industry and 20 units related to domestic area. Second column shows for total production of
                            150 units in the industry, total cost comes equal to 255 units, out of which 200 units relate to
                            agriculture, 25 for industry and 30 units for domestic part. Zero in third columns shows depicts that
                            domestic part is a consuming area, where not sells are made
                                                       Table 24.1: Input-Output Table


                                                        Purchase  area                        Total output or
                                   Areas               Agriculture(1)  Industry(2) Last Demand (3)  total receipt
                                   (1) Agriculture          50         200          50          300
                               Sell area  →  (2) Industry   55          25          70          150

                                                            20
                                                                                                50
                                   (3) Last Demand
                                                                        30
                                                                                    0
                                   Total cost or Total input  125      255          120         500
                               With the help of above table general Transaction Matrix can be created


                                                        Table 24.2: Transaction Matrix
                                                           Purchase area                    Total output

                                      Areas         Agriculture(1) Industry(2) Last Demand (3)
                               Sell area  →  (1) Agriculture  x 11   x 12         D 1 2         X 1 2

                                                                     x
                                                                                                X
                                                                                  D
                                     (2) Industry
                                                         x
                                                          21
                                                                      22
                                     (3) Last Demand     x           x            D             X
                                                          31          32           0              3
                            If we take columns of above table, then we will get following production function
       316                              LOVELY PROFESSIONAL UNIVERSITY

