
Page 364 - DECO504_STATISTICAL_METHODS_IN_ECONOMICS_ENGLISH
P. 364
Unit 28: Theory of Estimation: Point Estimation, Unbiasedness, Consistency, Efficiency and Sufficiency
Notes
1 15
7 (4, 5, 6) ( 45 ) ++ 6 = = 5.00
3 3
1 16
8 (4, 5, 7) ( 45 ) ++ 7 = = 5.33
3 3
1 17
) ++
9 (4, 6, 7) ( 467 = = 5.67
3 3
1 18
) ++
10 (5, 6, 7) ( 567 = = 6.00
3 3
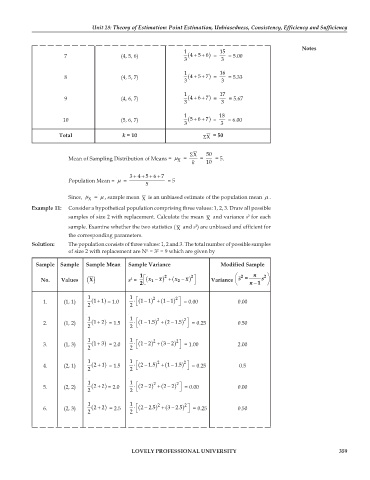
Total k = 10 ΣX = 50
ΣX 50
Mean of Sampling Distribution of Means = μ = k = 10 = 5.
X
3 + +++567
4
Population Mean = μ = = 5
5
Since, μ = μ , sample mean X is an unbiased estimate of the population mean μ .
X
Example 11: Consider a hypothetical population comprising three values: 1, 2, 3. Draw all possible
samples of size 2 with replacement. Calculate the mean X and variance s for each
2
sample. Examine whether the two statistics ( X and s ) are unbiased and efficient for
2
the corresponding parameters.
Solution: The population consists of three values: 1, 2 and 3. The total number of possible samples
of size 2 with replacement are N = 3 = 9 which are given by
n
2
Sample Sample Sample Mean Sample Variance Modified Sample
No. Values () s = 1 ⎡ ( ) 1 2 + x ( − x − x x ) 2 2 ⎤ Variance ⎜ ⎛ s ˆ = n s 2 ⎞ 2 ⎟
X
2
2 ⎣ ⎦ ⎝ n − 1 ⎠
1 1 ⎡ 2 2 ⎤
) +
1. (1, 1) ( 11 = 1.0 ⋅ ⎣ ( ) − 11 + ( ) − 1 1 ⎦ = 0.00 0.00
2 2
1 1 ⎡ 2 2 ⎤
) +
2. (1, 2) ( 12 = 1.5 ⋅ ⎣ ( ) − 11.5 + ( ) − 2 1.5 ⎦ = 0.25 0.50
2 2
1 1 ⎡ 2 2 ⎤
) +
3. (1, 3) ( 13 = 2.0 ⋅ ( ) − 12 + ( ) − 3 2 = 1.00 2.00
2 2 ⎣ ⎦
1 1 ⎡ 2 2 ⎤
) +
4. (2, 1) ( 21 = 1.5 ⋅ ⎣ ( ) − 2 1.5 + ( 1 1.5 ) − ⎦ = 0.25 0.5
2 2
1 1 ⎡ 2 2 ⎤
) +
5. (2, 2) ( 22 = 2.0 ⋅ ⎣ ( ) − 22 + ( ) − 22 ⎦ = 0.00 0.00
2 2
1 1 ⎡ 2 2 ⎤
) +
6. (2, 3) ( 22 = 2.5 ⋅ ⎣ ( ) − 2 2.5 + ( 3 2.5 ) − ⎦ = 0.25 0.50
2 2
LOVELY PROFESSIONAL UNIVERSITY 359