Page 390 - DMTH404_STATISTICS
P. 390
Statistics


                      Notes
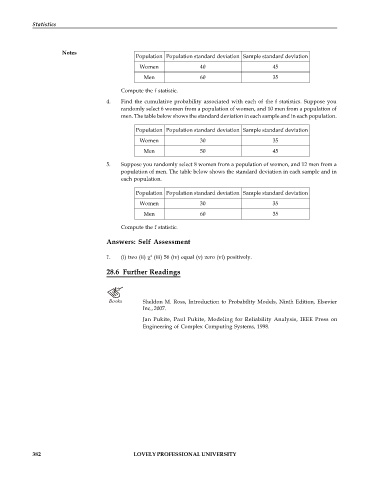
                                              Population  Population standard deviation  Sample standard deviation
                                               Women               40                      45

                                                 Men               60                      35

                                         Compute the f statistic.
                                    4.   Find the  cumulative probability  associated  with  each of the f  statistics. Suppose  you
                                         randomly select 6 women from a population of women, and 10 men from a population of
                                         men. The table below shows the standard deviation in each sample and in each population.
                                              Population  Population standard deviation  Sample standard deviation
                                               Women               30                      35

                                                 Men               50                      45

                                    5.   Suppose you randomly select 8 women from a population of women, and 12 men from a
                                         population of men. The table below shows the standard deviation in each sample and in
                                         each population.

                                              Population  Population standard deviation  Sample standard deviation

                                               Women               30                      35
                                                 Men               60                      35

                                         Compute the f statistic.
                                    Answers: Self  Assessment

                                                   2
                                    1.   (i) two (ii) c  (iii) 56 (iv) equal (v) zero (vi) positively.

                                    28.6 Further Readings


                                     Books      Sheldon M. Ross,  Introduction to Probability Models, Ninth Edition, Elsevier
                                                Inc., 2007.
                                                Jan  Pukite,  Paul  Pukite,  Modeling  for  Reliability Analysis,  IEEE  Press  on
                                                Engineering of Complex Computing Systems, 1998.


            382                              LOVELY PROFESSIONAL UNIVERSITY

