Page 382 - DECO401_MICROECONOMIC_THEORY_ENGLISH
P. 382
Unit-26: General Equilibrium Theory


                                                                                                     Notes
                                                 Fig. 26.5


                                                 Price


                                                    D


                                             –       +    E D
                                                   O
                                             Excess Demand


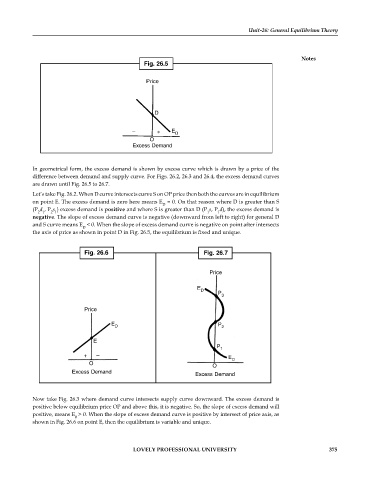
            In geometrical form, the excess demand is shown by excess curve which is drawn by a price of the
            difference between demand and supply curve. For Figs. 26.2, 26.3 and 26.4, the excess demand curves
            are drawn until Fig. 26.5 to 26.7.
            Let’s take Fig. 26.2. When D curve intersects curve S on OP price then both the curves are in equilibrium
            on point E. The excess demand is zero here means E  = 0. On that reason where D is greater than S
                                                       D
            (P d , P s ) excess demand is positive and where S is greater than D (P s, P d), the excess demand is
                                                                      1
              2 1
                                                                         1
                  2 1
            negative. The slope of excess demand curve is negative (downward from left to right) for general D
            and S curve means E  < 0. When the slope of excess demand curve is negative on point after intersects
                            D
            the axis of price as shown in point D in Fig. 26.5, the equilibrium is fixed and unique.
                             Fig. 26.6                              Fig. 26.7


                                                                      Price

                                                                  E
                                                                   D
                                                                         P
                                                                          3
                             Price

                                      E                                  P
                                       D                                  2

                                E
                                                                         P
                                                                          1
                             +   –                                           E
                                                                              D
                               O
                                                                       O
                         Excess Demand
                                                                  Excess Demand


            Now take Fig. 26.3 where demand curve intersects supply curve downward. The excess demand is
            positive below equilibrium price OP and above this, it is negative. So, the slope of excess demand will
            positive, means E  > 0. When the slope of excess demand curve is positive by intersect of price axis, as
                          0
            shown in Fig. 26.6 on point E, then the equilibrium is variable and unique.


                                             LOVELY PROFESSIONAL UNIVERSITY                                   375

