Page 388 - DECO401_MICROECONOMIC_THEORY_ENGLISH
P. 388
Unit-26: General Equilibrium Theory


                                                                                                     Notes
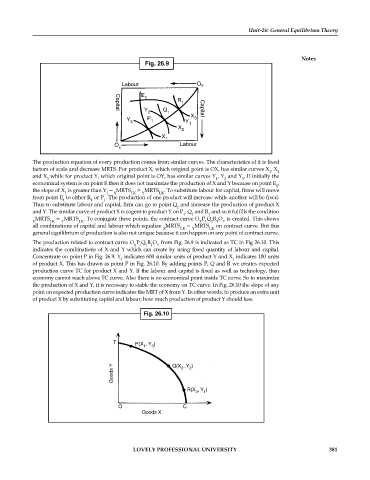
                                                 Fig. 26.9


                                         Labour                   O Y
                                         Labour
                                         Labour
                                                E
                                                 1
                                                            R
                                                             1
                                                 Y     Q           Capital
                                                  2     1
                                       Capital
                                                                X
                                           Y      P 1            3
                                            3                 Y
                                                                1
                                                            X
                                                             2
                                                       X
                                                        1
                                       O                     Labour
                                        x
            The production equation of every production comes from similar curves. The characteristics of it is fixed
            factors of scale and decrease MRTS. For product X, which original point is OX, has similar curves X , X
                                                                                             2
                                                                                          1
            and X  while for product Y, which original point is OY, has similar curves Y , Y  and Y . If initially the
                                                                        1
                                                                           2
                                                                                 3
                 3
            economical system is on point E then it does not maximize the production of X and Y because on point E ,
                                                                                            1
            the slope of X  is greater than Y — MRTS  >  MRTS . To substitute labour for capital, firms will move
                                                Y
                                            LK
                                                      LK
                                    1
                      1
                                       X
            from point E  to either R  or P . The production of one product will increase while another will be fixed.
                               1
                      1
                                   1
            Thus to substitute labour and capital, firm can go to point Q  and increase the production of product X
                                                            1
            and Y. The similar curve of product X is cogent to product Y on P , Q  and R  and so it fulfills the condition
                                                              1
                                                                1
                                                                      1
             MRTS  =  MRTS . To conjugate these points, the contract curve O P Q R O  is created. This shows
            X     LK  Y    LK                                      X 1  1 1  Y
            all combinations of capital and labour which equalize  MRTS  =  MRTS  on contract curve. But this
                                                       X
                                                                      LK
                                                                 Y
                                                             LK
            general equilibrium of production is also not unique because it can happen on any point of contract curve.
            The production related to contract curve O P Q R O  from Fig. 26.9 is indicated as TC in Fig 26.10. This
                                             X 1
                                                 1 1
                                                     Y
            indicates the combinations of X and Y which can create by using fixed quantity of labour and capital.
            Concentrate on point P in Fig. 26.9. Y  indicates 600 similar units of product Y and X  indicates 100 units
                                                                              1
                                         3
            of product X. This has drawn as point P in Fig. 26.10. By adding points P, Q and R we creates expected
            production curve TC for product X and Y. If the labour and capital is fixed as well as technology, then
            economy cannot reach above TC curve. Also there is no economical point inside TC curve. So to maximize
            the production of X and Y, it is necessary to stable the economy on TC curve. In Fig. 26.10 the slope of any
            point on expected production curve indicates the MRT of X from Y. In other words, to produce an extra unit
            of product X by substituting capital and labour, how much production of product Y should less.
                                                Fig. 26.10
                                      T       P(X , Y )
                                                 1  3
                                      Goods Y             Q(X , Y )
                                                             2
                                                                2
                                                               R(X , Y )
                                                                  3
                                                                    1
                                        O                     C
                                                Goods X
                                             LOVELY PROFESSIONAL UNIVERSITY                                   381

