Page 401 - DECO401_MICROECONOMIC_THEORY_ENGLISH
P. 401
Microeconomic Theory


                   Notes
                                                                   Fig. 28.2


                                                                    Risk Loving
                                                                               TU
                                                                             D
                                                             20
                                                            Utility  12   C
                                                             10           B
                                                                    A
                                                              4
                                                              0
                                                                      5000  10000  12000  15000  Income (`)


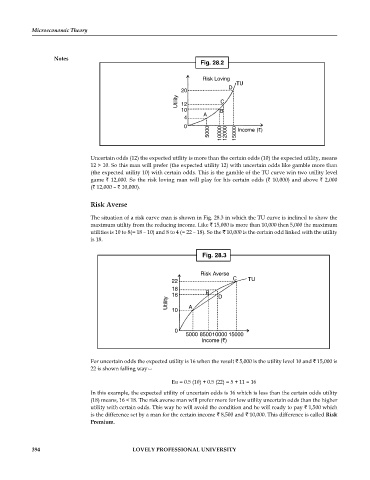
                               Uncertain odds (12) the expected utility is more than the certain odds (10) the expected utility, means
                               12 > 10. So this man will prefer (the expected utility 12) with uncertain odds like gamble more than
                               (the expected utility 10) with certain odds. This is the gamble of the TU curve win two utility level
                               game ` 12,000. So the risk loving man will play for his certain odds (` 10,000) and above ` 2,000
                               (` 12,000 – ` 10,000).

                               Risk Averse

                               The situation of a risk curve man is shown in Fig. 28.3 in which the TU curve is inclined to show the
                               maximum utility from the reducing income. Like   15,000 is more than 10,000 then 5,000 the maximum
                               utilities is 10 to 8(= 18 – 10) and 8 to 4 (= 22 – 18). So the   10,000 is the certain odd linked with the utility
                               is 18.

                                                                    Fig. 28.3


                                                                   Risk Averse
                                                                              C    TU
                                                          22
                                                          18
                                                          16         B   D
                                                        Utility

                                                          10   A


                                                           0
                                                              5000 850010000 15000
                                                                    Income (`)


                               For uncertain odds the expected utility is 16 when the result   5,000 is the utility level 10 and   15,000 is
                               22 is shown falling way—

                                                          Eu = 0.5 (10) + 0.5 (22) = 5 + 11 = 16
                               In this example, the expected utility of uncertain odds is 16 which is less than the certain odds utility
                               (18) means, 16 < 18. The risk averse man will prefer more for low utility uncertain odds than the higher
                               utility with certain odds. This way he will avoid the condition and he will ready to pay   1,500 which
                               is the difference set by a man for the certain income   8,500 and   10,000. This difference is called Risk
                               Premium.


            394                              LOVELY PROFESSIONAL UNIVERSITY

