Page 381 - DECO503_INTERNATIONAL_TRADE_AND_FINANCE_ENGLISH
P. 381
Unit 32 : India’s Balance of Payment


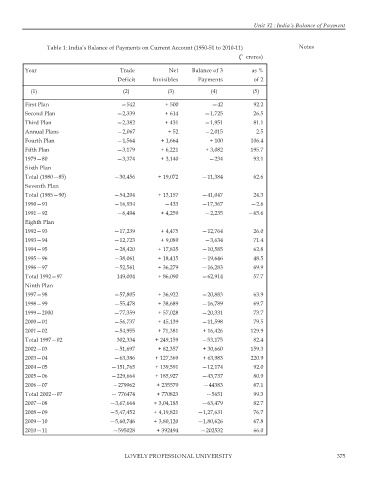
                Table 1: India’s Balance of Payments on Current Account (1950-51 to 2010-11)      Notes
                                                                                  (` (` crores)
                                                                              (`
                                                                              (`
                                                                              (`
         Year                           Trade           Net    Balance of 3       as %
                                       Deficit    Invisibles     Payments          of 2
           (1)                           (2)           (3)           (4)           (5)
         First Plan                     —542          + 500          —42           92.2
         Second Plan                   —2,339         + 614        —1,725          26.5
         Third Plan                    —2,382         + 431        —1,951          81.1
         Annual Plans                  —2,067          + 52        —2,015           2.5
         Fourth Plan                   —1,564        + 1,664         + 100        106.4
         Fifth Plan                    —3,179        + 6,221       + 3,082        195.7
         1979—80                       —3,374        + 3,140        —234           93.1
         Sixth Plan
         Total (1980—85)              —30,456       + 19,072      —11,384          62.6
         Seventh Plan
         Total (1985—90)              —54,204       + 13,157      —41,047          24.3
         1990—91                      —16,934         —433        —17,367         —2.6
         1991—92                       —6,494        + 4,259       —2,235        —65.6
         Eighth Plan
         1992—93                      —17,239        + 4,475      —12,764          26.0
         1993—94                      —12,723        + 9,089       —3,634          71.4
         1994—95                      —28,420       + 17,835      —10,585          62.8
         1995—96                      —38,061       + 18,415      —19,646          48.5
         1996—97                      —52,561       + 36,279      —16,283          69.9
         Total 1992—97                 149,004      + 86,090      —62,914          57.7
         Ninth Plan
         1997—98                      —57,805       + 36,922      —20,883          63.9
         1998—99                      —55,478       + 38,689      —16,789          69.7
         1999—2000                    —77,359       + 57,028      —20,331          73.7
         2000—01                      —56,737       + 45,139      —11,598          79.5
         2001—02                      —54,955       + 71,381      + 16,426        129.9
         Total 1997—02                 302,334     + 249,159      —53,175          82.4
         2002—03                      —51,697       + 82,357      + 30,660        159.3
         2003—04                      —63,386      + 127,369      + 63,983        220.9
         2004—05                     —151,765      + 139,591      —12,174          92.0
         2005—06                     —229,664      + 185,927      —43,737          80.9
         2006—07                     —279962        + 235579       —44383          87.1
         Total 2002—07               — 776474       + 770823        —5651          99.3
         2007—08                    —3,67,664      + 3,04,185     —63,479          82.7
         2008—09                    —5,47,452      + 4,19,821    —1,27,631         76.7
         2009—10                    —5,60,746      + 3,80,120    —1,80,626         67.8
         2010—11                     —595028        + 392494      —202532          66.0


                                         LOVELY PROFESSIONAL UNIVERSITY                                       375

