Page 385 - DECO503_INTERNATIONAL_TRADE_AND_FINANCE_ENGLISH
P. 385
Unit 32 : India’s Balance of Payment


        1994. The large build-up in foreign exchange assets has been made possible by large inflows of private  Notes
        foreign investments and Non-resident deposits. The foreign currency reserves have been further
        augmented to reach a level of $ 24.9 billion at the end of June 1997 and still further to $ 76.1 billion
        during 2002-03, and they shot up to $ 302.34 billion in June 2008. In the year 2008-09, however we
        witness a decline in foreign exchange reserves to $ 241.42 billion due to large scale outflow of foreign
        exchange by foreign institutional investors (FIIs). We again find an improved situation, as foreign
        exchange reserves reached $ 305 billion in 2010-11. The continued strength of these reserves has
        saved the country from the impending balance of payments crisis which was looming large in 1991.
        A point which needs serious consideration is : Is the escalation in these reserves a consequence of an
        improvement in the current account or the result of excessive borrowing or external assistance by
        bilateral or multilateral donors ? The answer obviously is : The sharp increase in foreign exchange
        reserves is the consequence of excessive borrowing and large inflows of external assistance. The
        Government has been trying to camouflage the situation by saying the non-debt creating assistance
        has been used to tide over the current crisis. But the distinction between debt and non-debt inflows
        does not reduce the burden of foreign exchange outflows. In case of debt, interest and amoritization
        payments constitute outflows and in the case of non-debt creating assistance, it is royalties and dividend
        outflows that lead to foreign exchange outgo. Both situations impose burdens on the country. The
        difference is only in form and not in substance.
        There is no doubt that both international and domestic factors have contributed to the deterioration
        in the balance of payments in 1997-98 and this is reflected by the increase in current account deficit to
        1.4 per cent of GDP and trade deficit rising to 4.9 per cent of GDP in 2004-05. The situation has
        deteriorated further and the trade deficit as per data available form DGCI&S is of the order of US $
        9.2 billion in 1998-99. This is because export (in US dollar terms) declined to US $ 34.3 billion in 1998-
        99 as against US $ 35.6 billion in 1997-98. The trade deficit has reached an unprecedented level of US
        $ 7.9 billion in 1998-99. Obviously, this is likely to be 3.2 per cent of GDP. To describe the “BOP
        situation as manageable” as the Economic Survey (1998-99) does, is to conceal the hard reality that
        the fundamentals of the economy are not sound and that all measures of export promotion have not
        produced the desired effect. To meet this deficit by a larger inflow from Resurgent India Bonds of the
        order of US $ 4.2 billion during 1998-99 from NRIs or larger inflow offoreign direct investment and
        external commercial borrowing only indicates the adoption of the dependency syndrome by.
        international players. The internal resilience of the economy is still weak and the economy has to be
        strengthened. This is evident from the fact that the Rupee depreciated against the US dollar by about
        7.1 per cent from ` 38.50 per US dollar in March 1998 to ` 45.68 per US dollar in 2000-0l. The situation
        has further worsened to ` 47.49 per US dollar in April 2000. It would be, therefore, more prudent to
        adopt a cautious approach in admitting large inflows of external commercial borrowing, portfolio
        investment by foreigners and also larger contributions from NRIs in the form of bonds.

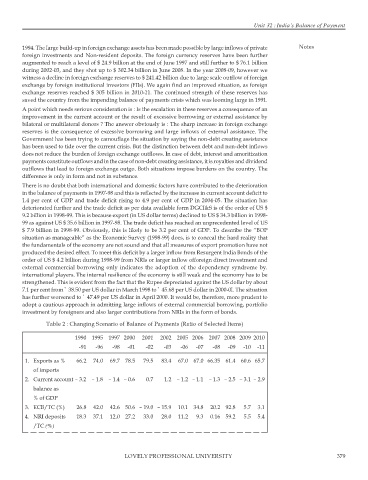
                Table 2 : Changing Scenario of Balance of Payments (Ratio of Selected Items)
                         1990 1995 1997 2000   2001  2002 2005 2006 2007 2008 2009 2010
                          -91   -96  -98  -01   -02   -03  -06  -07   -08  -09  -10  -11

         1. Exports as %  66.2  74.0  69.7 78.5  79.5  83.4  67.0 67.0 66.35 61.4 60.6 65.7
            of imports
         2. Current account – 3.2  – 1.8  – 1.4 – 0.6  0.7  1.2  – 1.2 – 1.1  – 1.3 – 2.5 – 3.1 – 2.9
            balance as
            % of GDP
         3. ECB/TC (%)    26.8  42.0  42.6 50.6 – 19.0 – 15.9  10.1 34.8  20.2 92.8  5.7  3.1
         4. NRI deposits  18.3  37.1  12.0 27.2  33.0  28.0  11.2  9.3  0.16 59.2  5.5  5.4
            /TC (%)


                                         LOVELY PROFESSIONAL UNIVERSITY                                       379

