Page 353 - DMTH404_STATISTICS
P. 353
Unit 24: Sampling Distributions


            The mean and standard deviation of population are                                     Notes

                            +
                                +
                        +
                     22 24 26 28
                  m =               =  25 and
                            4
                          2     2      2     2
                                    26
                              24
                                          28
                        22
                       ( ) +  ( ) +  ( ) +  ( )    2
                                                 25
                  s =                         -  ( ) =  5 =  2.236  respectively.
                                  4
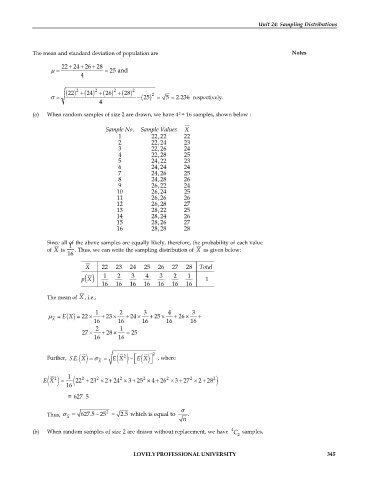
            (a)  When random samples of size 2 are drawn, we have 4 = 16 samples, shown below :
                                                            2
                                    Sample No.  Sample Values  X
                                        1          22,22      22
                                        2          22,24      23
                                        3          22,26      24
                                        4          22,28      25
                                        5          24,22      23
                                        6          24,24      24
                                        7          24,26      25
                                        8          24,28      26
                                        9          26,22      24
                                        10         26,24      25
                                        11         26,26      26
                                        12         26,28      27
                                        13         28,22      25
                                        14         28,24      26
                                        15         28,26      27
                                        16         28,28      28

                 Since all of the above samples are equally likely, therefore, the probability of each value
                        1
                 of X  is   . Thus, we can write the sampling distribution of  X  as given below:
                       16
                             X     22  23   24   25  26   27   28  Total
                            p X d i  1  2    3   4    3   2    1     1
                                   16  16   16   16  16   16   16

                 The mean of X , i.e.,

                                 1       2       3       4       3
                       ( ) =
                 m =  E X   22 ´   + 23 ´  + 24 ´  +  25 ´  +  26 ´  +
                  X
                                16      16      16      16      16
                                 2       1
                                       27 ´  +  28 ´  =  25
                                16      16
                                                    2
                                                ( )
                 Further,  S E X. . ( ) s=  X  =  E X 2  é ë E X ù , where
                                        ( ) -
                                                   û
                       1
                   2        2    2       2      2       2       2       2
                                                            +
               E X
                    ( ) =  ( 22 +  23 ´  2 24 ´  3 25 ´  4 26 ´  3 27 ´  2 28  )
                                                     +
                                     +
                                                                    +
                                             +
                       16
                                = 627.5
                                                             s
                                    2
                                 -
                 Thus, s  =  627.5 25 =  2.5 which is equal to   .
                       X
                                                              n
                                                                              4
            (b)  When random samples of size 2 are drawn without replacement, we have  C  samples,
                                                                                2
                                             LOVELY PROFESSIONAL UNIVERSITY                                  345

