
Page 442 - DMTH404_STATISTICS
P. 442
Statistics
Notes
Example 1: A random sample of 20 bulbs from a large lot revealed a standard deviation
of 150 hours. Assuming that the life of bulbs follow normal distribution, test the hypothesis that
the standard deviation of the population is 130 hours.
Solution.
We have to test H : s = 130 against H : s 130 (two tailed test).
0 a
20 150 2
´
2
The test statistics, under H is c = = 26.63 .
0 cal 2
130
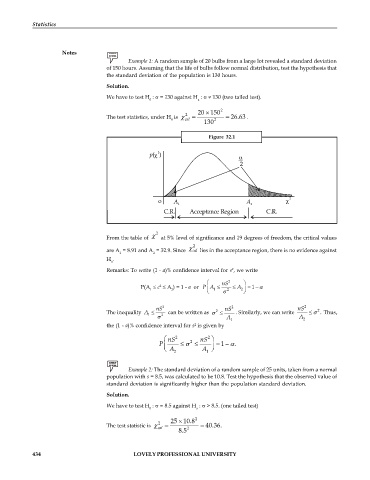
Figure 32.1
c 2
From the table of at 5% level of significance and 19 degrees of freedom, the critical values
are A = 8.91 and A = 32.9. Since c 2 cal lies in the acceptance region, there is no evidence against
1 2
H .
0
2
Remarks: To write (1 - a)% confidence interval for s , we write
æ nS 2 ö
-
2
P(A c A ) = 1 - a or P A A 2 ÷ = 1 a
1 2 ç 1 2
è s ø
nS 2 nS 2 nS 2 2
2
The inequality A can be written as s . Similarly, we can write s . Thus,
1 2
s A 1 A 2
2
the (1 - a)% confidence interval for s is given by
2
æ nS 2 nS ö
2
-
P s = 1 a .
ç ÷
è A 2 A ø
1
Example 2: The standard deviation of a random sample of 25 units, taken from a normal
population with s = 8.5, was calculated to be 10.8. Test the hypothesis that the observed value of
standard deviation is significantly higher than the population standard deviation.
Solution.
We have to test H : s= 8.5 against H : s > 8.5. (one tailed test)
0 a
25 10.8 2
´
2
The test statistic is c = = 40.36.
cal 2
8.5
434 LOVELY PROFESSIONAL UNIVERSITY