Page 437 - DMTH404_STATISTICS
P. 437
Unit 31: Hypothesis Testing
Notes
n n
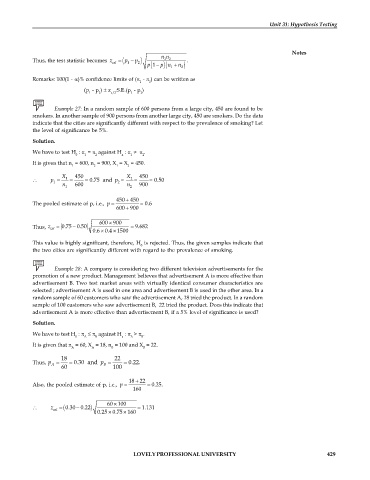
Thus, the test statistic becomes z cal = ( 1 p 2 ) 1 2 .
p -
p (1 p n- )( 1 + n 2 )
Remarks: 100(1 - )% confidence limits of ( - ) can be written as
1 2
(p - p ) ± z S.E.(p - p )
1 2 a/2 1 2
Example 27: In a random sample of 600 persons from a large city, 450 are found to be
smokers. In another sample of 900 persons from another large city, 450 are smokers. Do the data
indicate that the cities are significantly different with respect to the prevalence of smoking? Let
the level of significance be 5%.
Solution.
We have to test H : = against H : .
0 1 2 a 1 2
It is given that n = 600, n = 900, X = X = 450.
1 2 1 2
X 450 X 450
p = 1 = = 0.75 and p = 2 = = 0.50
1
2
n 600 n 900
1 2
+
450 450
The pooled estimate of p, i.e., p = = 0.6
600 900
+
600 900
´
z = 0.75 0.50 = 9.682
-
Thus, cal
´
0.6 0.4 1500
´
This value is highly significant, therefore, H is rejected. Thus, the given samples indicate that
0
the two cities are significantly different with regard to the prevalence of smoking.
Example 28: A company is considering two different television advertisements for the
promotion of a new product. Management believes that advertisement A is more effective than
advertisement B. Two test market areas with virtually identical consumer characteristics are
selected ; advertisement A is used in one area and advertisement B is used in the other area. In a
random sample of 60 customers who saw the advertisement A, 18 tried the product. In a random
sample of 100 customers who saw advertisement B, 22 tried the product. Does this indicate that
advertisement A is more effective than advertisement B, if a 5% level of significance is used?
Solution.
We have to test H : £ against H : > .
0 A B a A B
It is given that n = 60, X = 18, n = 100 and X = 22.
A A B B
18 22
Thus, p = = 0.30 and p = = 0.22.
A
B
60 100
18 22
+
Also, the pooled estimate of p, i.e., p = = 0.25.
160
60 100
´
z = (0.30 0.22- ) = 1.131
cal
0.25 0.75 160
´
´
LOVELY PROFESSIONAL UNIVERSITY 429

