Page 435 - DMTH404_STATISTICS
P. 435
Unit 31: Hypothesis Testing
Notes
E
The 100(1 - a)% confidence limits for m are X t± S . . .
/2 X
3
Thus, the 95% confidence limits for m are given by 68 2.093± ´ = 68 1.44 , i.e., 66.56 and
±
19
69.44 inches.
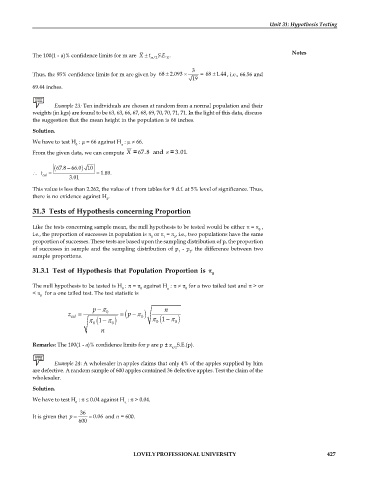
Example 23: Ten individuals are chosen at random from a normal population and their
weights (in kgs) are found to be 63, 63, 66, 67, 68, 69, 70, 70, 71, 71. In the light of this data, discuss
the suggestion that the mean height in the population is 66 inches.
Solution.
We have to test H : = 66 against H : 66.
0 a
From the given data, we can compute X =67.8 and s = 3.01.
(67.8 66.0- ) 10
t cal = = 1.89.
3.01
This value is less than 2.262, the value of t from tables for 9 d.f. at 5% level of significance. Thus,
there is no evidence against H .
0
31.3 Tests of Hypothesis concerning Proportion
Like the tests concerning sample mean, the null hypothesis to be tested would be either = ,
0
i.e., the proportion of successes in population is or = , i.e., two populations have the same
0 1 2
proportion of successes. These tests are based upon the sampling distribution of p, the proportion
of successes in sample and the sampling distribution of p - p , the difference between two
1 2
sample proportions.
31.3.1 Test of Hypothesis that Population Proportion is
0
The null hypothesis to be tested is H : = against H : for a two tailed test and > or
0 0 a 0
< for a one tailed test. The test statistic is
0
-
p n
z cal = 0 = (p - 0 )
(1 - ) 0 (1 - 0 )
0 0
n
Remarks: The 100(1 - a)% confidence limits for p are p ± z S.E.(p).
a/2
Example 24: A wholesaler in apples claims that only 4% of the apples supplied by him
are defective. A random sample of 600 apples contained 36 defective apples. Test the claim of the
wholesaler.
Solution.
We have to test H : £ 0.04 against H : > 0.04.
0 a
36
It is given that p = = 0.06 and n = 600.
600
LOVELY PROFESSIONAL UNIVERSITY 427

