
Page 432 - DMTH404_STATISTICS
P. 432
Statistics
Notes
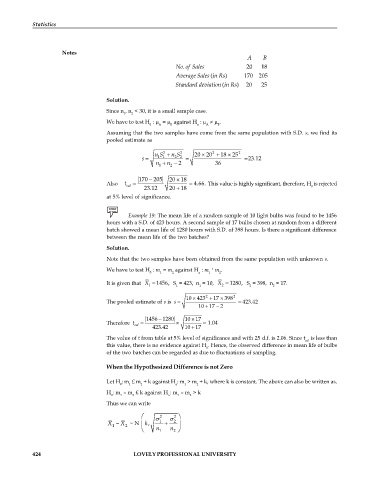
A B
No . of Sales 20 18
Average Sales (in Rs ) 170 205
Standard deviation (in Rs ) 20 25
Solution.
Since n , n < 30, it is a small sample case.
1 2
We have to test H : = against H : .
0 A B a A B
Assuming that the two samples have come from the same population with S.D. s, we find its
pooled estimate as
2
2
n S + n S 2 20 20 + 18 25 2
´
´
1 1
2 2
s = = = 23.12
n + n - 2 36
1 2
170 205 20 18
´
-
Also t cal = = 4.66. This value is highly significant, therefore, H is rejected
23.12 20 18 0
+
at 5% level of significance.
Example 19: The mean life of a random sample of 10 light bulbs was found to be 1456
hours with a S.D. of 423 hours. A second sample of 17 bulbs chosen at random from a different
batch showed a mean life of 1280 hours with S.D. of 398 hours. Is there a significant difference
between the mean life of the two batches?
Solution.
Note that the two samples have been obtained from the same population with unknown s.
We have to test H : m = m against H : m ¹ m .
0 1 2 a 1 2
It is given that X = 1456, S = 423, n = 10, X = 1280, S = 398, n = 17.
1
2
1
2
2
1
2
´
10 423 + 17 398 2
´
The pooled estimate of s is s = = 423.42
10 17 2
-
+
1456 1280 10 17
´
-
Therefore t cal = ´ = 1.04
+
423.42 10 17
The value of t from table at 5% level of significance and with 25 d.f. is 2.06. Since t is less than
cal
this value, there is no evidence against H . Hence, the observed difference in mean life of bulbs
0
of the two batches can be regarded as due to fluctuations of sampling.
When the Hypothesized Difference is not Zero
Let H : m £ m + k against H : m > m + k, where k is constant. The above can also be written as.
0 1 2 a 1 2
H : m – m £ k against H : m – m > k
0 1 2 a 1 2
Thus we can write
æ s 2 s 2 ö
X – X ~ N k ç , 1 + 2 ÷
2
1
è n 1 n 2 ø
424 LOVELY PROFESSIONAL UNIVERSITY