Page 121 - DMGT405_FINANCIAL%20MANAGEMENT
P. 121

(in millions excepts per
                                                                          2005
                                                       2002
                                                             2003
                                               2001
                                                                    2004
                                         2000
                                                                                 2006
                share data)
                Revenues
                Cost of goods sold
                                                     5,503.0  6,065.5  5,493.5  5,403.8  7,784.9
                                       2,865.3  3,906.7
                Gross profit
                                       1,895.6  2,563.9
                                                     3,683.5  3,487.6  3,283.4  3,591.3  3,703.9
                                                     2,303.7  2,623.8  2,426.6  2,606.4  2,689.7
                Selling and administrative
                                       1,209.8  1,588.6
                                                             863.8
                Operating Income
                                                                          984.9  1,014.2
                                        685.8
                                                     1,379.8
                                                                   856.8
                                               975.3
                                                       52.3
                Interst expense
                                                                           45.0
                                         24.2
                                                                                 58.7
                                                39.5
                                                             60.0
                                                                    44.1
                                                                           23.2
                                                                    21.5
                                         11.7
                                                                                 34.1
                                                             20.9
                Other expense net
                                                       32.3
                                                36.7
                                          ---
                Restructuring charge,net
                                                             129.9
                                                                    45.1
                                                                                  ---
                                                                           2.5
                                                 ---
                                                        ---
                                               899.1  1,295.20
                                                                                921.4
                                                                   746.1
                                                             653.0
                Income before Income taxes
                                                                          919.2
                                        649.9
                                                             253.4
                                                                          340.1
                                                                   294.7
                                               345.9
                                                      499.4
                Income taxes           4,760.8  6,470.6   9,816.5  9,553.1  8,776.9  8,995.1  9,488.8
                                        250.2
                                                                                331.7
                Net Income              399.7   553.2   795.8   399.6   451.4   579.4   589.7
                Diluted earning per Annum                                                     Unit 6: Cost of Capital
                Shares                    1.4    1.9    2.7   1.4    1.6   2.1    2.2
                Average shares outstanding
                (diluted)               294.0   293.6   297.0   296.0   287.5   279.8   273.3
                                                                                                  Notes
                Growth(%)
                Revenue                         35.9   42.0   4.0    8.1   2.5    5.5
                Operating income                42.2   41.5   37.4   0.8   15.0   3.0
                Net income                      38.4   43.9   49.8   13.0   28.3   1.8
                Margins (%)
                Gross margin                    39.6   40.1   36.5   37.4   39.9   39.0
                Operating margin                15.1   15.0   9.0    9.8   10.9   10.7
                Net margin                       8.5    8.7   4.2    3.1   6.4    6.2
                Effective tax rate (%)          38.5   38.6   38.8   39.5   37.0   36.0

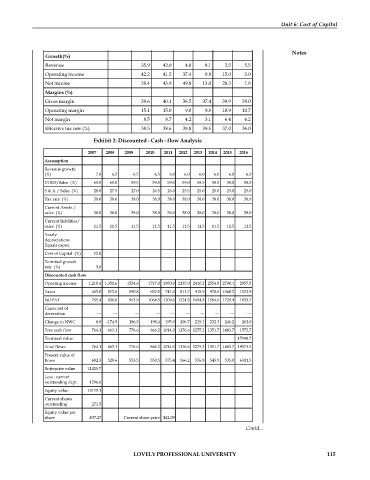
                                Exhibit 2: Discounted - Cash - flow Analysis
                              2007   2008   2009   2010   2011   2012   2013   2014   2015   2016
                Assumption
                Revenue growth
                (%)              7.0   6.5   6.5    6.5   6.0   6.0   6.0   6.0   6.0   6.0
                COGS/Sales  (%)   60.0   60.0   59.5   59.5   59.0   59.0   58.5   58.5   58.0   58.0
                S & A / Sales  (%)   28.0   27.5   27.0   26.5   26.0   25.5   25.0   25.0   25.0   25.0
                Tax rate  (%)   38.0   38.0   38.0   38.0   38.0   38.0   38.0   38.0   38.0   38.0
                Current Assets /
                sales  (%)      38.0   38.0   38.0   38.0   38.0   38.0   38.0   38.0   38.0   38.0
                Current liabilities/
                sales  (%)      11.5   11.5   11.5   11.5   11.5   11.5   11.5   11.5   11.5   11.5
                Yearly
                depreciations
                Equals capex.
                Cost of Capital  (%)   12.0
                Terminal growth
                rate  (%)        3.0
                Discounted cash flow
                Opeating income    1,218.4  1,351.6   1554.6   1717.0  1950.0  2135.9  2410.2  2554.8  2790.1   2957.5
                Taxes          463.0   513.6   590.8   652.5   741.0   811.7   915.9   970.8  1060.2   1123.9
                NOPAT          755.4   838.0   963.9   1064.5  1209.0  1324.3  1494.3  1584.0  1729.9   1833.7
                Capex.net of
                dereciation      ---   ---    ---    ---   ---   ---   ---   ---   ---   ---
                Change in NWC    8.8  -174.9   186.3   198.4   195.0   206.7   219.1   232.3   246.2   261.0
                Free cash flow   764.1   663.1   776.6   866.2  1014.0  1176.6  1275.2  1351.7  1483.7   1572.7
                Terminal value                                                   17998.7
                Total flows    764.1   663.1   776.6   866.2  1014.0  1176.6  1275.2  1351.7  1483.7  19571.5
                Present value of
                flows          682.3   528.6   553.5   550.5   575.4   566.2   576.8   545.9   535.0   6301.5
                Enterprise value   11415.7
                Less : current
                outstanding dept.   1296.6
                Equity value   10119.1
                Current shares
                outstanding    271.5
                Equity value per
                share          $37.27       Current share price  $42.09
                                                                                  Contd...
                                             LOVELY PROFESSIONAL UNIVERSITY                                  115
   116   117   118   119   120   121   122   123   124   125   126