
Page 198 - DMGT405_FINANCIAL%20MANAGEMENT
P. 198
Financial Management
Notes 10000 – 23206
Z = = – 1.414
1 9342
20000 – 23206
Z = = – 0.343
2 9342
According to Table Z, the probability corresponding to these values of Z is 0.4213 and 0.1341.
Since both are on the left side of the normal curve, the probability of having its value between
10,000 and 20,000 would be the difference i.e. 0.4213 – 0.1341 = 0.2872 i.e., 28.72%.
35000 – 23206
At least 35,000 Z = = 1.262
9342
According to table Z, the probability of having the NPV values 35,000 is 0.3965. The probability
of having NPV 35,000 or more would be 0.5 – 0.3965 = 0.1035 or 10.35%.
7000 – 23206
At least 7000 in this case Z = = – 1.735
9342
According to Table Z, the probability of having the NPV value of 7000 is 0.4586. The probability
of NPV at least equal to 7000 would be more by 0.50 (area to the right side of the mean) i.e.
0.9586 or 95.86%.
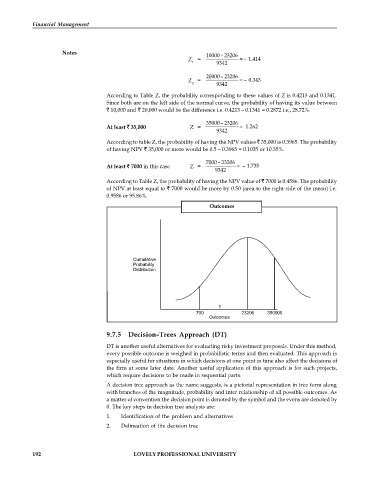
Outcomes
Cumulative
Probability
Distribution
1
700 23206 350000
Outcomes
9.7.5 Decision–Trees Approach (DT)
DT is another useful alternatives for evaluating risky investment proposals. Under this method,
every possible outcome is weighed in probabilistic terms and then evaluated. This approach is
especially useful for situations in which decisions at one point in time also affect the decisions of
the firm at some later date. Another useful application of this approach is for such projects,
which require decisions to be made in sequential parts.
A decision tree approach as the name suggests, is a pictorial representation in tree form along
with branches of the magnitude, probability and inter relationship of all possible outcomes. As
a matter of convention the decision point is denoted by the symbol and the evens are denoted by
0. The key steps in decision tree analysis are:
1. Identification of the problem and alternatives
2. Delineation of the decision tree
192 LOVELY PROFESSIONAL UNIVERSITY