Page 196 - DMGT405_FINANCIAL%20MANAGEMENT
P. 196

Financial Management


                      Notes
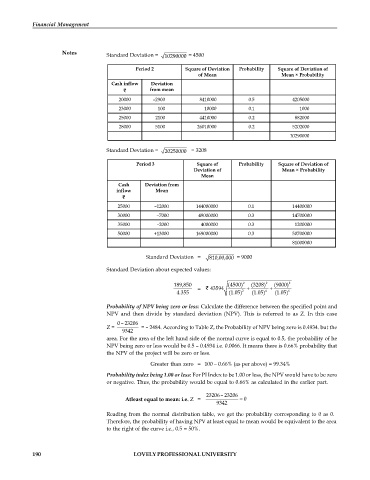
                                    Standard Deviation =  10290000 = 4500

                                              Period 2        Square of Deviation   Probability   Square of Deviation of
                                                                   of Mean                    Mean × Probability
                                      Cash inflow   Deviation
                                                   from mean
                                        20000       –2900          8410000         0.5            4205000
                                        23000        100             10000         0.1              1000
                                        25000       2100           4410000         0.2             882000
                                        28000       5100          26010000         0.2            5202000
                                                                                                 10290000

                                    Standard Deviation =  20250000   = 3208

                                              Period 3            Square of     Probability   Square of Deviation of
                                                                 Deviation of                 Mean × Probability
                                                                    Mean
                                        Cash     Deviation from
                                        inflow      Mean

                                        25000       –12000        144000000        0.1            14400000
                                        30000        –7000         49000000        0.3            14700000
                                        35000        –2000         4000000         0.3             1200000
                                        50000       +13000        169000000        0.3            50700000
                                                                                                  81000000

                                                 Standard Deviation =  810,00,000  = 9000
                                    Standard Deviation about expected values:

                                                           189,850          (4500) 2  (3208) 2  (9000) 2
                                                                  =    43594             
                                                           4.355             (1.05)  2  (1.05) 4  (1.05) 6

                                    Probability of NPV being zero or less: Calculate the difference between the specified point and
                                    NPV  and  then divide  by standard  deviation  (NPV). This is  referred to as Z.  In this  case
                                        0 – 23206
                                    Z =         = – 2484. According to Table Z, the Probability of NPV being zero is 0.4934. but the
                                         9342
                                    area. For the area of the left hand side of the normal curve is equal to 0.5, the probability of he
                                    NPV being zero or less would be 0.5 – 0.4934 i.e. 0.0066. It means there is 0.66% probability that
                                    the NPV of the project will be zero or less.

                                                   Greater than zero = 100 – 0.66% (as per above) = 99.34%
                                    Probability index being 1.00 or less: For PI Index to be 1.00 or less, the NPV would have to be zero
                                    or negative. Thus, the probability would be equal to 0.66% as calculated in the earlier part.

                                                                     23206 – 23206
                                          Atleast equal to mean: i.e. Z =         0
                                                                         9342
                                    Reading from the normal distribution table, we get the probability corresponding to 0 as 0.
                                    Therefore, the probability of having NPV at least equal to mean would be equivalent to the area
                                    to the right of the curve i.e., 0.5 = 50%.


            190                              LOVELY PROFESSIONAL UNIVERSITY
   191   192   193   194   195   196   197   198   199   200   201