Page 416 - DECO401_MICROECONOMIC_THEORY_ENGLISH
P. 416

Unit-29: Insurance Choice and Risk


                                                                                                     Notes
                                                 Fig. 29.5


                                          E R
                                       Expected rate of return  R  Efficiency  M  K  F


                                               Frontier
                                                     N

                                                    E
                                          O
                                                     r    r
                                                      1   2
                                             Standard Deviation (Risk)


            The Optimal Portfolio
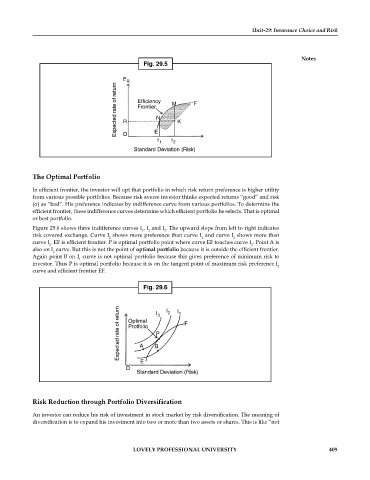
            In efficient frontier, the investor will opt that portfolio in which risk return preference is higher utility
            from various possible portfolios. Because risk averse investor thinks expected returns “good” and risk
            (σ) as “bad”. His preference indicates by indifference curve from various portfolios. To determine the
            efficient frontier, these indifference curves determine which efficient portfolio he selects. That is optimal
            or best portfolio.
            Figure 29.6 shows three indifference curves I , I  and I . The upward slope from left to right indicates
                                                1
                                                       3
                                                  2
            risk covered exchange. Curve I  shows more preference than curve I  and curve I  shows more than
                                                                    1
                                                                              3
                                     2
            curve I . EF is efficient frontier. P is optimal portfolio point where curve EF touches curve I . Point A is
                                                                                    2
                 2
            also on I  curve. But this is not the point of optimal portfolio because it is outside the efficient frontier.
                   2
            Again point B on I  curve is not optimal portfolio because this gives preference of minimum risk to
                           1
            investor. Thus P is optimal portfolio because it is on the tangent point of maximum risk preference I
                                                                                             2
            curve and efficient frontier EF.
                                                Fig. 29.6
                                        Expected rate of return  Optimal  B I P 3  I 2  I 1  F
                                           Protfolio


                                               A

                                               E
                                           O
                                              Standard Deviation (Risk)


            Risk Reduction through Portfolio Diversification

            An investor can reduce his risk of investment in stock market by risk diversification. The meaning of
            diversification is to expand his investment into two or more than two assets or shares. This is like “not


                                             LOVELY PROFESSIONAL UNIVERSITY                                   409
   411   412   413   414   415   416   417   418   419   420   421