Page 373 - DECO504_STATISTICAL_METHODS_IN_ECONOMICS_ENGLISH
P. 373
Statistical Methods in Economics


                   Notes          Such an interval, when it exists, is called a Confidence Interval for  θ . The two quantities t  and t
                                                                                                           1    2
                                  which serve as the lower and upper limits of the interval are known as Confidence Limits. The probability
                                  (c) with which the confidence interval will include the true value of the parameter is known as
                                  Confidence Coefficient of the interval.
                                  The significance of confidence limits is that if many independent random samples are drawn from
                                  the same population and the confidence interval is calculated from each sample, then the parameter
                                  will actually be included in the intervals in c proportion of cases in the long run. Thus the estimate of
                                  the parameter is stated as an interval with a specified degree of confidence.
                                  The calculation of confidence limits is based on the knowledge of sampling distribution of an
                                  appropriate statistic. Suppose, we have a random sample of size n from a Normal population
                                  N ( μ σ,  2 ) , where the variance   σ 2   is known. It is required to find 95% confidence limits for the

                                  unknown parameter  μ . We know that the sample mean ( ) x  follows normal distribution with mean

                                  μ  and variance  σ /n , and so
                                                 2
                                                                         x  −  μ
                                                                     z =   σ
                                                                           n
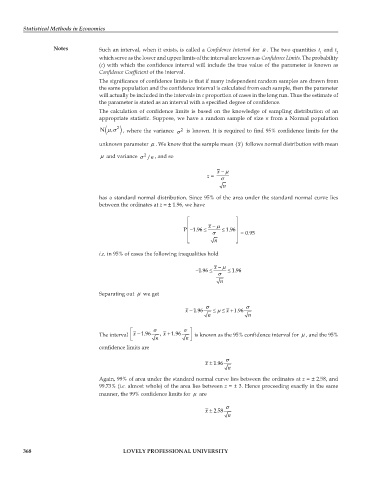
                                  has a standard normal distribution. Since 95% of the area under the standard normal curve lies
                                  between the ordinates at z = ± 1.96, we have

                                                               ⎡               ⎤
                                                               ⎢      x  − μ   ⎥
                                                                − P  ≤ ⎢  ≤  1.96 ⎥ 1.96
                                                               ⎢       σ       ⎥   = 0.95
                                                               ⎢        n      ⎦  ⎥ ⎣

                                  i.e. in 95% of cases the following inequalities hold
                                                                        x  −  μ
                                                                  −   ≤1.96  ≤  1.96
                                                                         σ
                                                                          n

                                  Separating out  μ  we get
                                                                     σ            σ
                                                              x  − 1.96  ≤  μ ≤ +1.96x
                                                                      n            n

                                            ⎡       σ         σ ⎤
                                  The interval  ⎢  x  −  , 1.96  x  +  1.96  ⎥   is known as the 95% confidence interval for  μ , and the 95%
                                            ⎣       n         n  ⎦
                                  confidence limits are
                                                                            σ
                                                                     x  ± 1.96
                                                                            n

                                  Again, 99% of area under the standard normal curve lies between the ordinates at z = ± 2.58, and
                                  99.73% (i.e. almost whole) of the area lies between z = ± 3. Hence proceeding exactly in the same
                                  manner, the 99% confidence limits for  μ  are
                                                                            σ
                                                                     x  ± 2.58
                                                                            n


         368                              LOVELY PROFESSIONAL UNIVERSITY

