Page 375 - DECO504_STATISTICAL_METHODS_IN_ECONOMICS_ENGLISH
P. 375
Statistical Methods in Economics


                   Notes


                                          (i)  The ‘probable limits’ (without any reference to the degree of confidence) may be taken
                                              to be ‘almost sure limits’ in all the above cases.
                                          (ii)  The formulae for S.E. involve population parameters. If these parameters are not
                                              known, an approximate value of S.E. may be obtained by substituting the statistic
                                              for the corresponding parameter.]


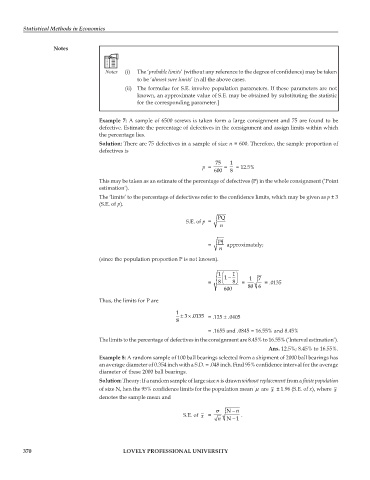
                                  Example 7: A sample of 6500 screws is taken form a large consignment and 75 are found to be
                                  defective. Estimate the percentage of defectives in the consignment and assign limits within which
                                  the percentage lies.
                                  Solution: There are 75 defectives in a sample of size n = 600. Therefore, the sample proportion of
                                  defectives is

                                                                        75   1
                                                                    p =    =    = 12.5%
                                                                        600  8
                                  This may be taken as an estimate of the percentage of defectives (P) in the whole consignment (‘Point
                                  estimation’).
                                  The ‘limits’ to the percentage of defectives refer to the confidence limits, which may be given as p ± 3
                                  (S.E. of p).

                                                                         PQ
                                                               S.E. of p =
                                                                          n

                                                                         pq
                                                                      =      approximately;
                                                                          n
                                  (since the population proportion P is not known).

                                                                         1  ⎛  − ⎟ 1  1  ⎞
                                                                               ⎠
                                                                      =   8  ⎜  ⎝  8  =   1  7   = .0135
                                                                           600     80 6
                                  Thus, the limits for P are

                                                           1  3
                                                           8  ±×.0135 = .125 ± .0405

                                                                      = .1655 and .0845 = 16.55% and 8.45%
                                  The limits to the percentage of defectives in the consignment are 8.45% to 16.55% (‘Interval estimation’).
                                                                                          Ans. 12.5%; 8.45% to 16.55%.
                                  Example 8: A random sample of 100 ball bearings selected from a shipment of 2000 ball bearings has
                                  an average diameter of 0.354 inch with a S.D. = .048 inch. Find 95% confidence interval for the average
                                  diameter of these 2000 ball bearings.
                                  Solution: Theory: If a random sample of large size n is drawn without replacement from a finite population
                                  of size N, hen the 95% confidence limits for the population mean  μ  are  x  ± 1.96 (S.E. of x), where  x
                                  denotes the sample mean and

                                                                        σ   N  − n
                                                              S.E. of  x =       .
                                                                              −
                                                                         n  N1


         370                              LOVELY PROFESSIONAL UNIVERSITY

