Page 378 - DECO504_STATISTICAL_METHODS_IN_ECONOMICS_ENGLISH
P. 378
Unit 29: Methods of Point Estimation and Interval Estimation


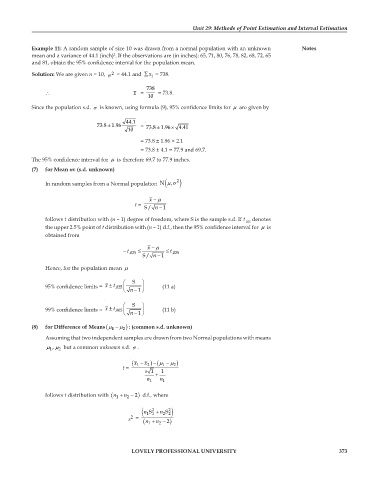
            Example 11: A random sample of size 10 was drawn from a normal population with an unknown  Notes
            mean and a variance of 44.1 (inch) . If the observations are (in inches): 65, 71, 80, 76, 78, 82, 68, 72, 65
                                       2
            and 81, obtain the 95% confidence interval for the population mean.
                                      2
            Solution: We are given n = 10,  σ  = 44.1 and  ∑x  = 738.
                                                   i
                                                  738
                ∴                            x =   10   = 73.8.

            Since the population s.d. σ  is known, using formula (9), 95% confidence limits for  μ  are given by
                                           44.1
                                 73.8  ± 1.96   =  73.8 1.96 ×
                                                     ±
                                           10               4.41
                                                = 73.8 ± 1.96 × 2.1
                                                = 73.8 ± 4.1 = 77.9 and 69.7.
            The 95% confidence interval for  μ  is therefore 69.7 to 77.9 inches.
            (7)  for Mean m: (s.d. unknown)

                In random samples from a Normal population  ( μ σN  ,  2 )

                                                  x  −  μ
                                              t =   S/ n − 1
                follows t distribution with (n – 1) degree of freedom, where S is the sample s.d. If t   denotes
                                                                                  .025
                the upper 2.5% point of t distribution with (n – 1) d.f., then the 95% confidence interval for  μ  is
                obtained from
                                                  x  −  μ
                                          −  .025  ≤ t  ≤  t .025
                                                S/ n − 1
                Hence, for the population mean  μ


                                          ⎛  S  ⎞
                                     ±
                95% confidence limits =   xt .025 ⎜  ⎟  (11 a)
                                          ⎝  − ⎠ n  1
                                          ⎛  S  ⎞
                                     ±
                99% confidence limits =   xt .005 ⎜  ⎟  (11 b)
                                          ⎝  − ⎠ n  1
            (8)  for Difference of Means(  μ  − μ  2 ) 1  : (common s.d. unknown)
                Assuming that two independent samples are drawn from two Normal populations with means
                  ,
                μ μ  but a common unknown s.d. σ .
                    2
                 1
                                               − x  ) (μ − x  μ −  )
                                             ( 1  2    1  2
                                          t =
                                                 s  1  +  1
                                                  n 1  n 1
                follows t distribution with  (  + n  2  − n  2  d.f., where
                                               ) 1

                                                        S
                                                 n
                                                  S
                                                ( 11 2  + n 2 2 2 )
                                            s  =   (  + n  2  − n  2 ) 1
                                            2

                                             LOVELY PROFESSIONAL UNIVERSITY                                      373

