Page 379 - DECO504_STATISTICAL_METHODS_IN_ECONOMICS_ENGLISH
P. 379

Statistical Methods in Economics


                   Notes              Hence, with 95% probability the following inequalities hold


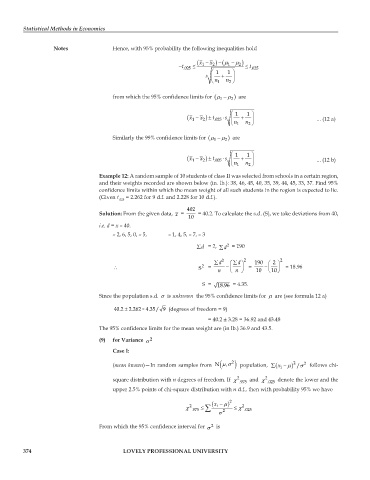
                                                            −  .025  ≤t  ( 1  − x  2  ) (μ − x  1  μ −  2 )  ≤  t .025
                                                                     s  ⎛  ⎜  +  1  ⎞ 1  ⎟
                                                                       ⎝  n  n 2  ⎠ 1

                                      from which the 95% confidence limits for (  1  μ −  2 )μ   are


                                                               (  − x  2  ) 1  ± x  ⋅t  s  ⎛  + ⎜ .025  1  ⎞ 1  ⎟  ... (12 a)
                                                                             ⎝  n  n 2  ⎠ 1
                                      Similarly the 99% confidence limits for  (  1  μ −  2 )μ   are


                                                               (  − x  2 ) 1  ± x  ⋅t  s  ⎛  + ⎜ .005  1  ⎞ 1  ⎟  ... (12 b)
                                                                             ⎝  n  n 2  ⎠ 1

                                  Example 12: A random sample of 10 students of class II was selected from schools in a certain region,
                                  and their weights recorded are shown below (in. lb.): 38, 46, 45, 40, 35, 39, 44, 45, 33, 37. Find 95%
                                  confidence limits within which the mean weight of all such students in the region is expected to lie.
                                  (Given t   = 2.262 for 9 d.f. and 2.228 for 10 d.f.).
                                        .025
                                                               402
                                  Solution: From the given data,  x  =    = 40.2. To calculate the s.d. (S), we take deviations from 40,
                                                               10
                                  i.e. d = x – 40.
                                      – 2, 6, 5, 0, – 5,   – 1, 4, 5, – 7, – 3
                                                                  ∑d = 2,   ∑d 2   = 190

                                                                        ∑  2  ⎛  ∑d  d  ⎞  2  190  ⎛  ⎞ 2  2
                                      ∴                            S 2  =   − ⎜  ⎟   =   −  ⎜  ⎟   = 18.96
                                                                             ⎝ n  ⎠ n     ⎝ 10  ⎠ 10

                                                                    S=  18.96  = 4.35.
                                  Since the population s.d. σ  is unknown  the 95% confidence limits for  μ  are (see formula 12 a)

                                       40.2  ± 2.262  × 4.35/ 9  (degrees of freedom = 9)
                                                                      = 40.2 ± 3.28 = 36.92 and 43.48
                                  The 95% confidence limits for the mean weight are (in lb.) 36.9 and 43.5.
                                  (9)  for Variance  σ 2

                                      Case I:
                                                                                                      2
                                      (mean known)—In random samples from  ( μ σN  ,  2 )  population,  (  ∑  − x  μ ) i  2  / σ  follows chi-

                                      square distribution with n degrees of freedom. If  χ 2 .975   and  χ 2 .025   denote the lower and the
                                      upper 2.5% points of chi-square distribution with n d.f., then with probability 95% we have

                                                              χ  2 .975  ≤  ∑ (  x  −  μ ) i  2  ≤  χ  2 .025
                                                                         σ 2

                                  From which the 95% confidence interval for  σ 2   is


         374                              LOVELY PROFESSIONAL UNIVERSITY
   374   375   376   377   378   379   380   381   382   383   384