
Page 394 - DECO504_STATISTICAL_METHODS_IN_ECONOMICS_ENGLISH
P. 394
Unit 30: Types of Hypothesis: Null and Alternative, Types of Errors in Testing Hypothesis and Level of Significance
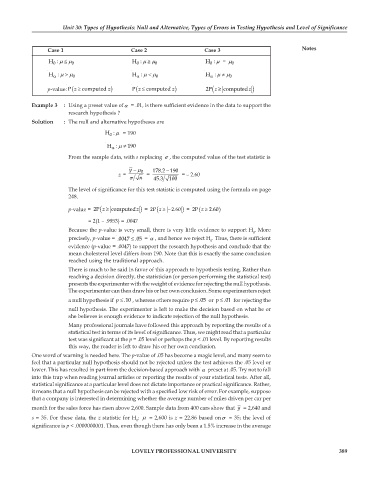
Case 1 Case 2 Case 3 Notes
≥
H: μ ≤ μ 0 H: μ μ 0 H: μ = μ 0
0
0
0
H: μ > μ 0 H: μ < μ 0 H: μ ≠ μ 0
α
α
α
p-value: ( P z ) ≥ computed z P ( z ) ≤ computed z 2P ( ≥ computedz z )
Example 3 : Using a preset value ofα = .01, is there sufficient evidence in the data to support the
research hypothesis ?
Solution : The null and alternative hypotheses are
H: μ = 190
0
H: μ ≠ 190
α
From the sample data, with s replacing σ , the computed value of the test statistic is
y − μ 0 178.2 − 190
z = = = – 2.60
σ n 45.3 100
The level of significance for this test statistic is computed using the formula on page
248.
p-value = ( 2P z ) ≥ computedz = 2P ( ≥− 2.60z ) = 2P z ) ≥ 2.60
(
= 2(1 – .9953) = .0047
Because the p-value is very small, there is very little evidence to support H . More
0
precisely, p-value = .0047 ≤ .05 = α , and hence we reject H . Thus, there is sufficient
0
evidence (p-value = .0047) to support the research hypothesis and conclude that the
mean cholesterol level differs from 190. Note that this is exactly the same conclusion
reached using the traditional approach.
There is much to he said in favor of this approach to hypothesis testing. Rather than
reaching a decision directly, the statistician (or person performing the statistical test)
presents the experimenter with the weight of evidence for rejecting the null hypothesis.
The experimenter can then draw his or her own conclusion. Some experimenters reject
a null hypothesis if ≤ .10p , whereas others require ≤ .05p or ≤ .01p for rejecting the
null hypothesis. The experimenter is left to make the decision based on what he or
she believes is enough evidence to indicate rejection of the null hypothesis.
Many professional journals have followed this approach by reporting the results of a
statistical test in terms of its level of significance. Thus, we might read that a particular
test was significant at the p = .05 level or perhaps the p < .01 level. By reporting results
this way, the reader is left to draw his or her own conclusion.
One word of warning is needed here. The p-value of .05 has become a magic level, and many seem to
feel that a particular null hypothesis should not be rejected unless the test achieves the .05 level or
lower. This has resulted in part from the decision-based approach with α preset at .05. Try not to fall
into this trap when reading journal articles or reporting the results of your statistical tests. After all,
statistical significance at a particular level does not dictate importance or practical significance. Rather,
it means that a null hypothesis can be rejected with a specified low risk of error. For example, suppose
that a company is interested in determining whether the average number of miles driven per car per
month for the sales force has risen above 2,600. Sample data from 400 cars show that y = 2,640 and
s = 35. For these data, the z statistic for H : μ = 2,600 is z = 22.86 based onσ = 35; the level of
0
significance is p < .0000000001. Thus, even though there has only been a 1.5% increase in the average
LOVELY PROFESSIONAL UNIVERSITY 389