
Page 392 - DECO504_STATISTICAL_METHODS_IN_ECONOMICS_ENGLISH
P. 392
Unit 30: Types of Hypothesis: Null and Alternative, Types of Errors in Testing Hypothesis and Level of Significance
using a different value for α then they must compute a new rejection region before reaching a Notes
decision concerning H and H . An alternative approach to hypothesis testing follows the following
a
0
steps: specify the null and alternative hypotheses, specify a value for α , collect the sample data, and
determine the weight of evidence for rejecting the null hypothesis. This weight, given in terms of a
probability, is called the level of significance (or p-value) of the statistical test. More formally, the
level of significance is defined as follows: the probability of obtaining a value of the test statistic that is as
likely or more likely to reject H as the actual observed value of the test statistic, assuming that the null hypothesis
0
is true. Thus, if the level of significance is a small value, then the sample data fail to support H and
0
our decision is to reject H . On the other hand, if the level of significance is a large value, then we fail
0
to reject H . We must next decide what is a large or small value for the level of significance.
0
Decision Rule for Hypothesis Testing Using the p-Value
1. If the p-value α≤ , then reject H .
0
2. If the p-value >α , then fail to reject H .
0
We illustrate the calculation of a level of significance with several examples.
Example 1 : (a) Determine the level of significance (p-value) for the statistical test and reach a
decision concerning the research hypothesis using α = .01.
(b) If the preset value of α is .05 instead of .01, does your decision concerning H
a
change ?
Solution :
(a) The null and alternative hypotheses are
H : μ ≤ 380
0
H : μ > 380
a
From the sample data, with s replacing σ , the computed value of the test statistic
is
y − 380 390 − 380
z = = = 2.01
σ / n 35.2/ 50
The level of significance for this test (i.e., the weight of evidence for rejecting H )
0
is the probability of observing a value of y greater than or equal to 390 assuming
that the null hypothesis is true; that is, μ = 380. This value can be computed by
using the z-value of the test statistic, 2.01, because p-value = P(y ≥ 390 ,
assuming μ = 380) = P(z ≥ 2.01)
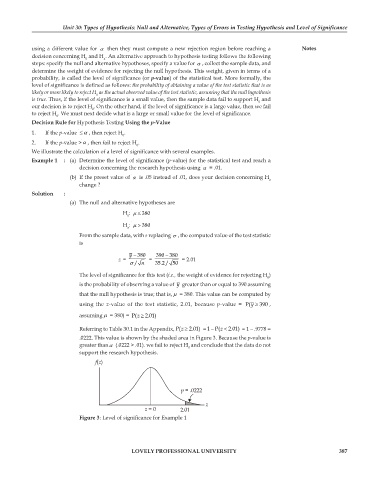
Referring to Table 30.1 in the Appendix, P(z ≥ 2.01) = − 1P(z < 2.01) = 1 – .9778 =
.0222. This value is shown by the shaded area in Figure 3. Because the p-value is
greater thanα (.0222 > .01). we fail to reject H and conclude that the data do not
0
support the research hypothesis.
f()
z
p = .0222
z
z = 0 2.01
Figure 3: Level of significance for Example 1
LOVELY PROFESSIONAL UNIVERSITY 387