
Page 390 - DECO504_STATISTICAL_METHODS_IN_ECONOMICS_ENGLISH
P. 390
Unit 30: Types of Hypothesis: Null and Alternative, Types of Errors in Testing Hypothesis and Level of Significance
Notes
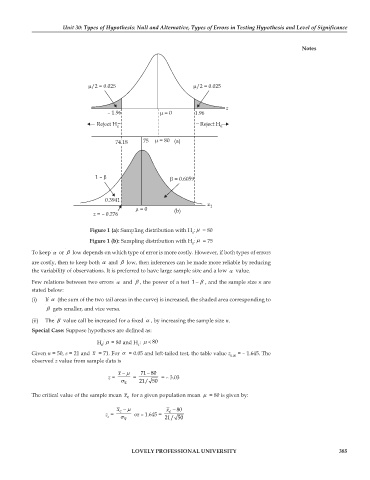
/2 = 0.025 /2 = 0.025
z
– 1.96 =0 1.96
Reject H e Reject H e
74.18 75 =80 (a)
1– = 0.6059
0.3941
z 1
=0 (b)
z = – 0.276
Figure 1 (a): Sampling distribution with H : μ = 80
0
Figure 1 (b): Sampling distribution with H : μ = 75
0
To keep α or β low depends on which type of error is more costly. However, if both types of errors
are costly, then to keep both α and β low, then inferences can be made more reliable by reducing
the variability of observations. It is preferred to have large sample size and a low α value.
Few relations between two errors α and β , the power of a test −1 β , and the sample size n are
stated below:
(i) If α (the sum of the two tail areas in the curve) is increased, the shaded area corresponding to
β gets smaller, and vice versa.
(ii) The β value call be increased for a fixed α , by increasing the sample size n.
Special Case: Suppose hypotheses are defined as:
H : μ = 80 and H : μ < 80
0 1
Given n = 50, s = 21 and x = 71. For α = 0.05 and left-tailed test, the table value z = – 1.645. The
0.05
observed z value from sample data is
x − μ 71 − 80
z = = = – 3.03
σ x 21/ 50
The critical value of the sample mean x for a given population mean μ = 80 is given by:
c
x c − μ x − 80
z = or – 1.645 = c
c σ x 21/ 50
LOVELY PROFESSIONAL UNIVERSITY 385