
Page 388 - DECO504_STATISTICAL_METHODS_IN_ECONOMICS_ENGLISH
P. 388
Unit 30: Types of Hypothesis: Null and Alternative, Types of Errors in Testing Hypothesis and Level of Significance
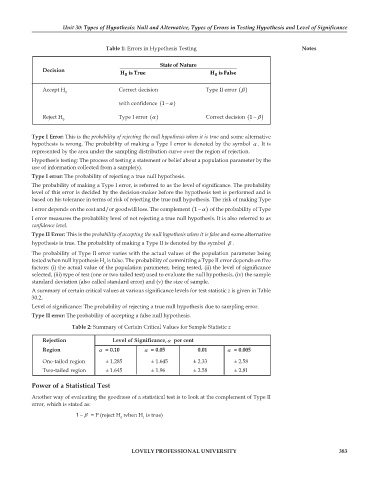
Table 1: Errors in Hypothesis Testing Notes
State of Nature
Decision H is True H is False
0
0
β
Accept H Correct decision Type II error ()
0
with confidence ( 1 α ) −
α
Reject H Type I error () Correct decision ( 1 β ) −
0
Type I Error: This is the probability of rejecting the null hypothesis when it is true and some alternative
hypothesis is wrong. The probability of making a Type I error is denoted by the symbol α . It is
represented by the area under the sampling distribution curve over the region of rejection.
Hypothesis testing: The process of testing a statement or belief about a population parameter by the
use of information collected from a sample(s).
Type I error: The probability of rejecting a true null hypothesis.
The probability of making a Type I error, is referred to as the level of significance. The probability
level of this error is decided by the decision-maker before the hypothesis test is performed and is
based on his tolerance in terms of risk of rejecting the true null hypothesis. The risk of making Type
I error depends on the cost and/or goodwill loss. The complement ( 1 α of the probability of Type
) −
I error measures the probability level of not rejecting a true null hypothesis. It is also referred to as
confidence level.
Type II Error: This is the probability of accepting the null hypothesis when it is false and some alternative
hypothesis is true. The probability of making a Type II is denoted by the symbol β .
The probability of Type II error varies with the actual values of the population parameter being
tested when null hypothesis H is false. The probability of committing a Type II error depends on five
0
factors: (i) the actual value of the population parameter, being tested, (ii) the level of significance
selected, (iii) type of test (one or two tailed test) used to evaluate the null hypothesis, (iv) the sample
standard deviation (also called standard error) and (v) the size of sample.
A summary of certain critical values at various significance levels for test statistic z is given in Table
30.2.
Level of significance: The probability of rejecting a true null hypothesis due to sampling error.
Type II error: The probability of accepting a false null hypothesis.
Table 2: Summary of Certain Critical Values for Sample Statistic z
Rejection Level of Significance,α per cent
Region α = 0.10 α = 0.05 0.01 α = 0.005
One-tailed region ± 1.285 ± 1.645 ± 2.33 ± 2.58
Two-tailed region ± 1.645 ± 1.96 ± 2.58 ± 2.81
Power of a Statistical Test
Another way of evaluating the goodness of a statistical test is to look at the complement of Type II
error, which is stated as:
1 − β = P (reject H when H is true)
0 1
LOVELY PROFESSIONAL UNIVERSITY 383