Page 414 - DMTH404_STATISTICS
P. 414
Statistics
Notes
2
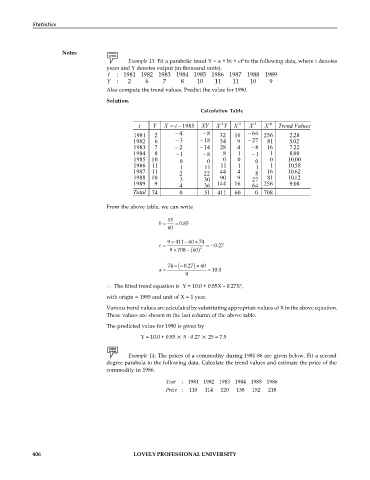
Example 13: Fit a parabolic trend Y = a + bt + ct to the following data, where t denotes
years and Y denotes output (in thousand units).
t : 1981 1982 1983 1984 1985 1986 1987 1988 1989
Y : 2 6 7 8 10 11 11 10 9
Also compute the trend values. Predict the value for 1990.
Solution.
Calculation Table
2
t Y X = 1985 XY X Y X 2 X 3 X 4 Trend Values
t
.
1981 2 4 8 32 16 64 256 2 28
1982 6 3 18 54 9 27 81 502
.
1983 7 2 14 28 4 8 16 7 22
.
1984 8 1 8 8 1 1 1 888
.
1985 10 0 0 0 0 0 0 10 00
.
1986 11 1 11 11 1 1 1 1058
.
.
1987 11 2 22 44 4 8 16 10 62
1988 10 3 30 90 9 27 81 1012
.
.
1989 9 4 36 144 16 64 256 9 08
Total 74 0 51 411 60 0 708
From the above table, we can write
51
b = = 0.85
60
9 411 60 74
c = 2 = 0.27
60
9 708 ( )
74 (0.27 ) 60
a = = 10.0
9
2
The fitted trend equation is Y = 10.0 + 0.85X – 0.27X ,
with origin = 1985 and unit of X = 1 year.
Various trend values are calculated by substituting appropriate values of X in the above equation.
These values are shown in the last column of the above table.
The predicted value for 1990 is given by
Y = 10.0 + 0.85 5 - 0.27 25 = 7.5
Example 14: The prices of a commodity during 1981-86 are given below. Fit a second
degree parabola to the following data. Calculate the trend values and estimate the price of the
commodity in 1986.
Year : 1981 1982 1983 1984 1985 1986
Price : 110 114 120 138 152 218
406 LOVELY PROFESSIONAL UNIVERSITY

