Page 416 - DMTH404_STATISTICS
P. 416
Statistics
Notes
Example 15:
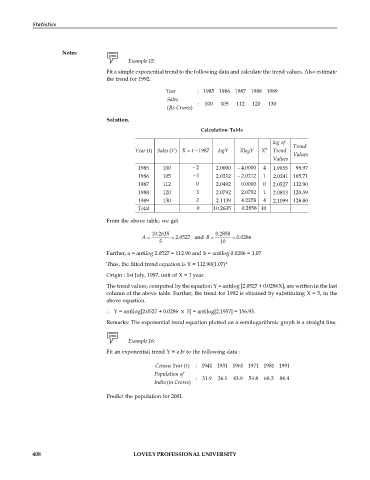
Fit a simple exponential trend to the following data and calculate the trend values. Also estimate
the trend for 1992.
Year : 1985 1986 1987 1988 1989
Sales
: 100 105 112 120 130
(Rs Crores )
Solution.
Calculation Table
log of
Trend
t
Year ( ) Sales ( ) X = 1987 logY XlogY X 2 Trend
t
Y
Values
Values
1985 100 2 2.0000 4.0000 4 1.9955 98.97
1986 105 1 2.0212 2.0212 1 2.0241 105.71
1987 112 0 2.0492 0.0000 0 2.0527 112.90
1988 120 1 2.0792 2.0792 1 2.0813 120.59
1989 130 2 2.1139 4.2278 4 2.1099 128.80
Total 0 10.2635 0.2858 10
From the above table, we get
10.2635 0.2858
A = = 2.0527 and B = = 0.0286
5 10
Further, a = antilog 2.0527 = 112.90 and b = antilog 0.0286 = 1.07
Thus, the fitted trend equation is Y = 112.90(1.07) X
Origin : 1st July, 1987, unit of X = 1 year.
The trend values, computed by the equation Y = antilog [2.0527 + 0.0286X], are written in the last
column of the above table. Further, the trend for 1992 is obtained by substituting X = 5, in the
above equation.
Y = antilog[2.0527 + 0.0286 5] = antilog[2.1957] = 156.93.
Remarks: The exponential trend equation plotted on a semilogarithmic graph is a straight line.
Example 16:
t
Fit an exponential trend Y = a.b to the following data :
Census Year ( ) : 1941 1951 1961 1971 1981 1991
t
Population of
: 31.9 36.1 43.9 54.8 68.3 84.4
India (in Crores )
Predict the population for 2001.
408 LOVELY PROFESSIONAL UNIVERSITY

