Page 66 - DMGT405_FINANCIAL%20MANAGEMENT
P. 66

Financial Management


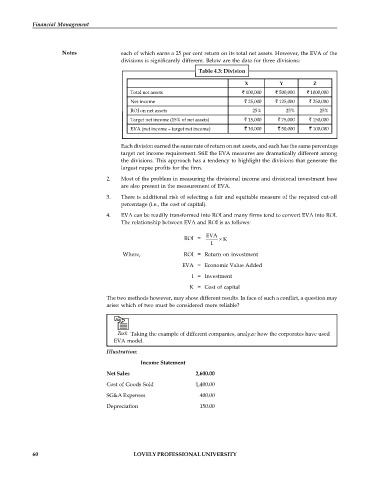
                      Notes              each of which earns a 25 per cent return on its total net assets. However, the EVA of the
                                         divisions is significantly different. Below are the data for three divisions:
                                                                   Table 4.3: Division

                                                                                  X           Y          Z
                                            Total net assets                       100,000    500,000    1000,000
                                            Net income                              25,000    125,000    250,000
                                            ROI on net assets                        25%        25%        25%

                                            Target net income (15% of net assets)    15,000    75,000    150,000
                                            EVA (net income – target net income)    10,000     50,000    100,000

                                         Each division earned the same rate of return on net assets, and each has the same percentage
                                         target net income requirement. Still the EVA measures are dramatically different among
                                         the divisions. This approach has a tendency to highlight the divisions that generate the
                                         largest rupee profits for the firm.
                                    2.   Most of the problem in measuring the divisional income and divisional investment base
                                         are also present in the measurement of EVA.
                                    3.   There is additional risk of selecting a fair and equitable measure of the required cut-off
                                         percentage (i.e., the cost of capital).
                                    4.   EVA can be readily transformed into ROI and many firms tend to convert EVA into ROI.
                                         The relationship between EVA and ROI is as follows:

                                                                     EVA
                                                              ROI =        K
                                                                       1
                                          Where,              ROI = Return on investment
                                                             EVA = Economic Value Added
                                                                I = Investment

                                                                K = Cost of capital
                                    The two methods however, may show different results. In face of such a conflict, a question may
                                    arise: which of two must be considered more reliable?


                                        Task  Taking the example of different companies, analyze how the corporates have used
                                       EVA model.
                                    Illustration:
                                                             Income Statement

                                    Net Sales                     2,600.00
                                    Cost of Goods Sold            1,400.00
                                    SG&A Expenses                  400.00
                                    Depreciation                   150.00


            60                               LOVELY PROFESSIONAL UNIVERSITY
   61   62   63   64   65   66   67   68   69   70   71