Page 76 - DMGT405_FINANCIAL%20MANAGEMENT
P. 76

Financial Management


                      Notes         5.2.2  Probability Distribution

                                    Probability distribution provides a more quantitative insight into an assets risk. The probability
                                    of a given charge is its chance of occurring.


                                       Notes  An outcome with probability of 80% occurrence is expected 8 out of 10 times. An
                                       outcome with probability of 100% is certain to happen. Outcomes with probability of zero
                                       will never occur.
                                    A probability distribution is a model that relates probabilities to the associated outcomes. The
                                    simplest type of probability distribution is the bar chart, which only shows a limited number of
                                    outcomes. The bar charts for N company Asset A and Asset B are shown in Figure 5.1. Although
                                    both assets have the same must likely returns, the range of return is much greater or more
                                    dispersed for Asset B than for Asset A – 16 per cent versus 4 per cent.
                                                  Figure 5.1: Possible Outcomes and Associated Probabilities

                                          70
                                        Probability of Occurences  60  Probability of Occurences 70
                                                                        60
                                                                        50
                                          50
                                                                        40
                                          40
                                                                        30
                                          30
                                                                        20
                                          20
                                          10

                                                5   9  13  17           10    5       9   13     17     21  25
                                                  Return %                               Return %

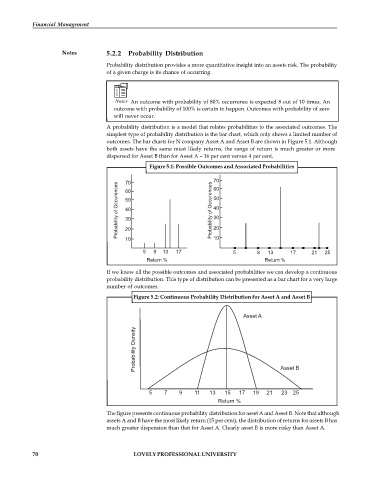
                                    If we know all the possible outcomes and associated probabilities we can develop a continuous
                                    probability distribution. This type of distribution can be presented as a bar chart for a very large
                                    number of outcomes.
                                             Figure 5.2: Continuous Probability Distribution for Asset A and Asset B


                                                                                 Asset A
                                              Probability Density                             Asset B


                                                  5    7    9    11   13   15   17   19  21   23  25
                                                                         Return %

                                    The figure presents continuous probability distribution for asset A and Asset B. Note that although
                                    assets A and B have the most likely return (15 per cent), the distribution of returns for assets B has
                                    much greater dispension than that for Asset A. Clearly asset B is more risky than Asset A.


            70                               LOVELY PROFESSIONAL UNIVERSITY
   71   72   73   74   75   76   77   78   79   80   81