Page 313 - DMTH404_STATISTICS
P. 313
Unit 22: Correlation
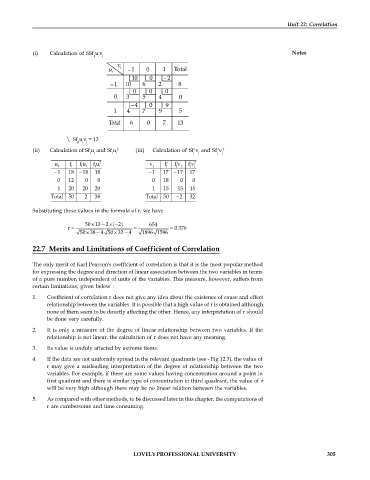
(i) Calculation of SSf u v Notes
ij i j
\ Sf u v = 13
ij i j
(ii) Calculation of Sf u and Sf u 2 (iii) Calculation of Sf'v and Sf'v 2
i i i i j j j j
u f f u f u 2 v f f v f v 2
i i i i i i j j j j j j
1 18 18 18 1 17 17 17
0 12 0 0 0 18 0 0
1 20 20 20 1 15 15 15
Total 50 2 38 Total 50 2 32
Substituting these values in the formula of r, we have
50 13 2 2 654
r 0.376
50 38 4 50 32 4 1896 1596
22.7 Merits and Limitations of Coefficient of Correlation
The only merit of Karl Pearson's coefficient of correlation is that it is the most popular method
for expressing the degree and direction of linear association between the two variables in terms
of a pure number, independent of units of the variables. This measure, however, suffers from
certain limitations, given below :
1. Coefficient of correlation r does not give any idea about the existence of cause and effect
relationship between the variables. It is possible that a high value of r is obtained although
none of them seem to be directly affecting the other. Hence, any interpretation of r should
be done very carefully.
2. It is only a measure of the degree of linear relationship between two variables. If the
relationship is not linear, the calculation of r does not have any meaning.
3. Its value is unduly affected by extreme items.
4. If the data are not uniformly spread in the relevant quadrants (see - Fig 12.3), the value of
r may give a misleading interpretation of the degree of relationship between the two
variables. For example, if there are some values having concentration around a point in
first quadrant and there is similar type of concentration in third quadrant, the value of r
will be very high although there may be no linear relation between the variables.
5. As compared with other methods, to be discussed later in this chapter, the computations of
r are cumbersome and time consuming.
LOVELY PROFESSIONAL UNIVERSITY 305

